I've been orienteering and navigating around the country for decades. I started life in the UK's marvellous Lake District, wandering freely on the fells, Later became a Scout, and then ran a Scout Troup. Now in my mid-seventies I am in no way competitive, and six years ago was immobilised for several months with a severe back problem- but get great satisfaction from just completing a course.
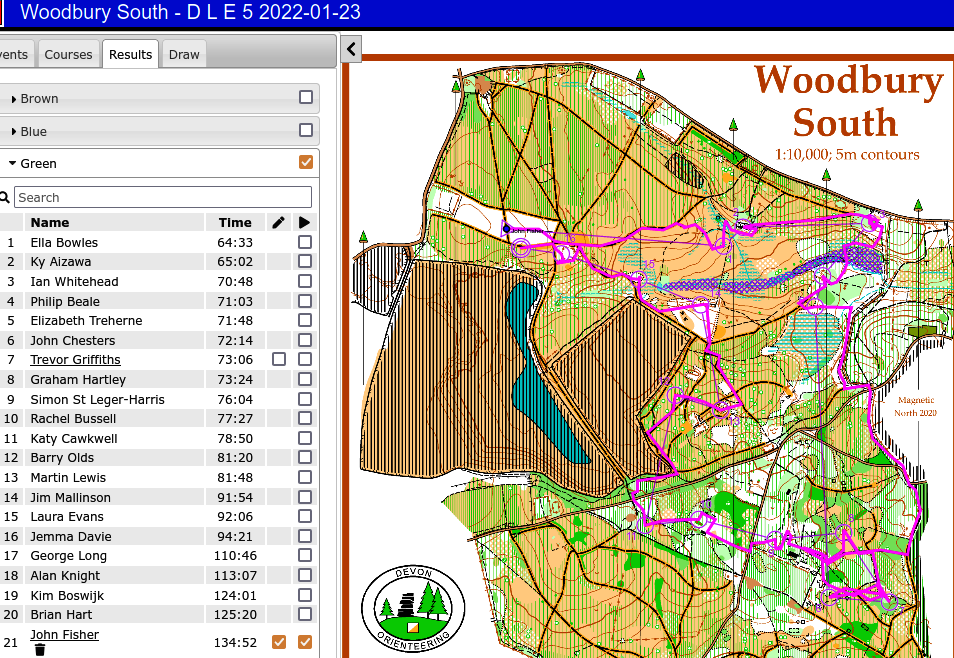
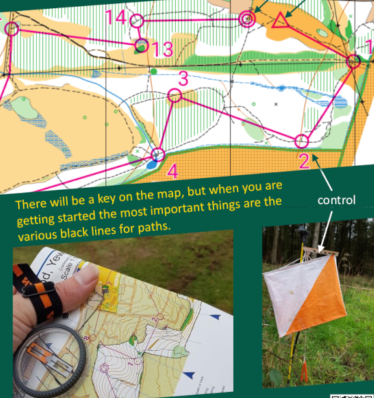
Here's the map I collected as a competitor in a recent O-meeting.
I wanted colour coding to allow it to be easier to see where I was when my route crossed itself- typically when I was ( ?temporarily? ?only occasionally?) lost near a control.
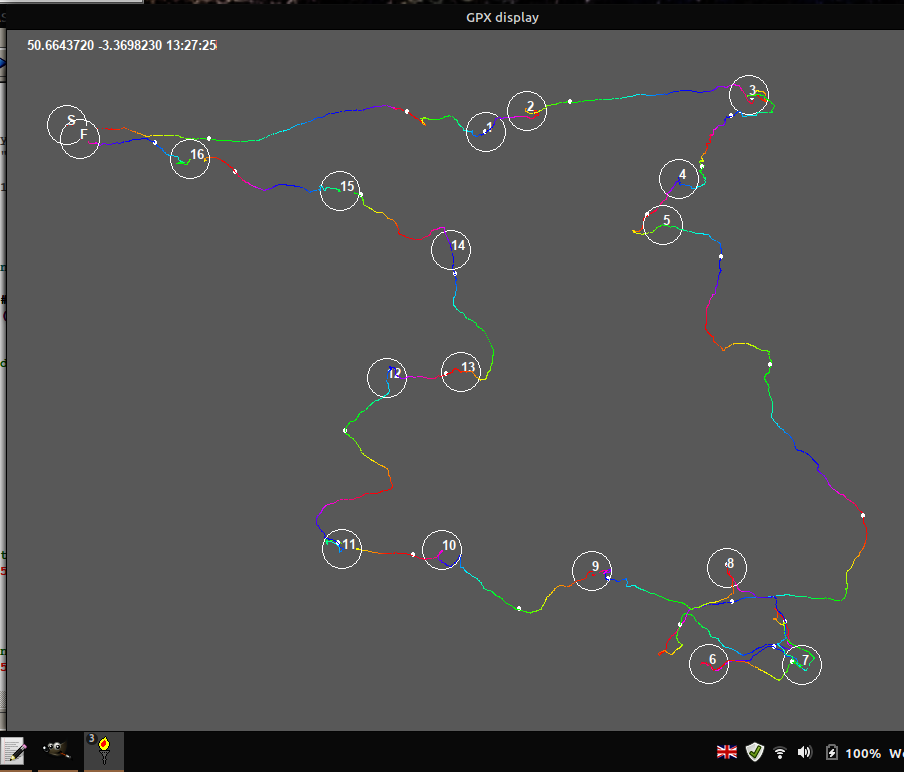
.. and here are the kind of maps of my actual course I am creating with Liberty BASIC.
-
I've always loved maps and navigation. I get real exhileration from the combination of physical achievement and natural beauty, whether with others or on my own. I taught many pupils to enjoy 'the great outdoors' safely. The sport of Orienteering uses custom maps, showing features of the landscape and how easily ( 'runnable') or with difficulty ( 'fight') they may be navigated. Control points define a route on your map, but YOU decide the fastest route. It is often called 'cunning running'. It is a highly competitive international sport.
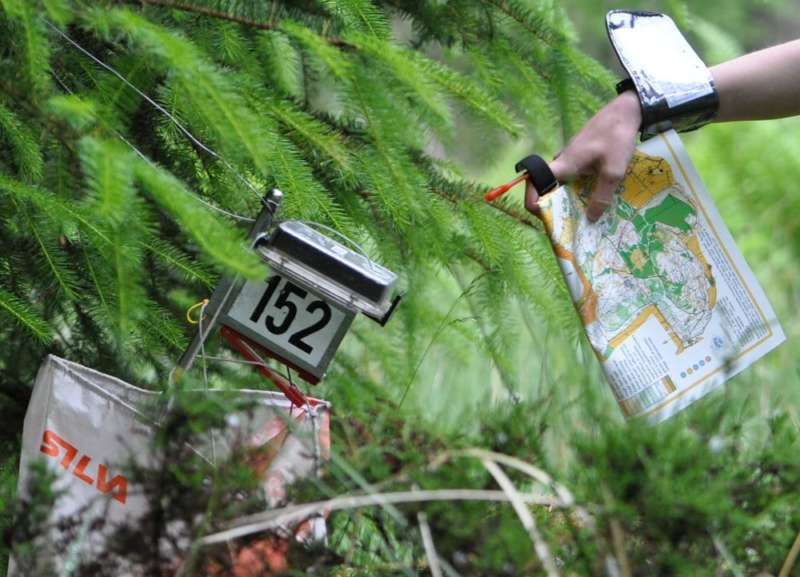
In its modern form, you prove that you reached each point by a small 'dibber' device which you insert in an electronic device at each point- or, contactless, are within a couple of metres. When I started, you found a small needle-punch that you clamped on your paper control card, and the dot pattern was the proof.
-
-
At the finish, your time is printed out and your current position. You are disqualified for missing a control, or punching in wrong order. The results of the whole day are uploaded, and you can see them on line. In the example below I added my route MANUALLY, ie from what I remembered of it. Note that you can replay it online as an animation, against any other competitor who entered their route. If the course itself is not set up to save your route to MapRun/RouteGadget you can record it with Strava or MapRun and upload the GPX file of your ACTUAL route- and compare that with where you THOUGHT you were!
-
Since essentially everyone now carries a smart phone with GPS their track can be recorded in fine detail. Software like RouteGadget, Strava and MapRun. These tracks can also be seen online, and you can animate your track and show those of other competitors. In fact there are now ( COVID friendly) permanent courses which are virtual in that no control flags have to be put in position, and you can avoid human contact by doing the course at any chosen date/time.
However since the file-format used ( often GPX) is easily parsed in Liberty BASIC, I've had a few hours of fun creating my own displays. Particularly, by putting time markers and an HGV colour coding I can see easily where I lost time!
This is rendered by the browser as below...
Green O course
10249.6249.6
. . . . . .
You can see that a GPX file is actually XML. I strip out the lat, long and time; find max and min to locate the result path all on-screen; and I then play with different ways of presentation.
You have to read all the data first, to extract the max/min values, then read again to plot. I have used both saving to a file and to arrays to make this a bit faster. Code below is a typical example. It should read any gpx file, but since one degree of latitude does not equal one of longitude ( except on the Equator) you need to add a correction.
' Parses data from GPXfiles- eg Woodbury_Common_Green_O_Course_.gpx
' Typical waypoint data entry...
'
' 249.6
'
'
'nomainwin
global col$, rd, gn, bu, xyOpen, gOpen, xOpen
open "Zorig.gpx" for input as #fIn
data$ =input$( #fIn, lof( #fIn))
close #fIn
if fileExists( DefaultDir$, "Zdata.dat") <>0 then goto [H]
open "Zdata.dat" for output as #fOut
xyOpen = 1
p = 0
minX =1e6: maxX =-1e6
minY =1e6: maxY =-1e6
minE =1e6: maxE =-1e6
do
p =instr( data$, "lat=", p +1)
lat$ =mid$( data$, p +5, 10)
lat =val( lat$)
minY =min( minY, lat)
maxY =max( maxY, lat)
p =instr( data$, "lon=", p +1)
lon$ =mid$( data$, p +5, 10)
lon =val( lon$)
minX =min( minX, lon)
maxX =max( maxX, lon)
p =instr( data$, "", p +1)
ele$ =mid$( data$, p +5, 5)
ele =val( ele$)
minE =min( minE, ele)
maxE =max( maxE, ele)
p =instr( data$, "

 -
- 
 -
- 
 -
-