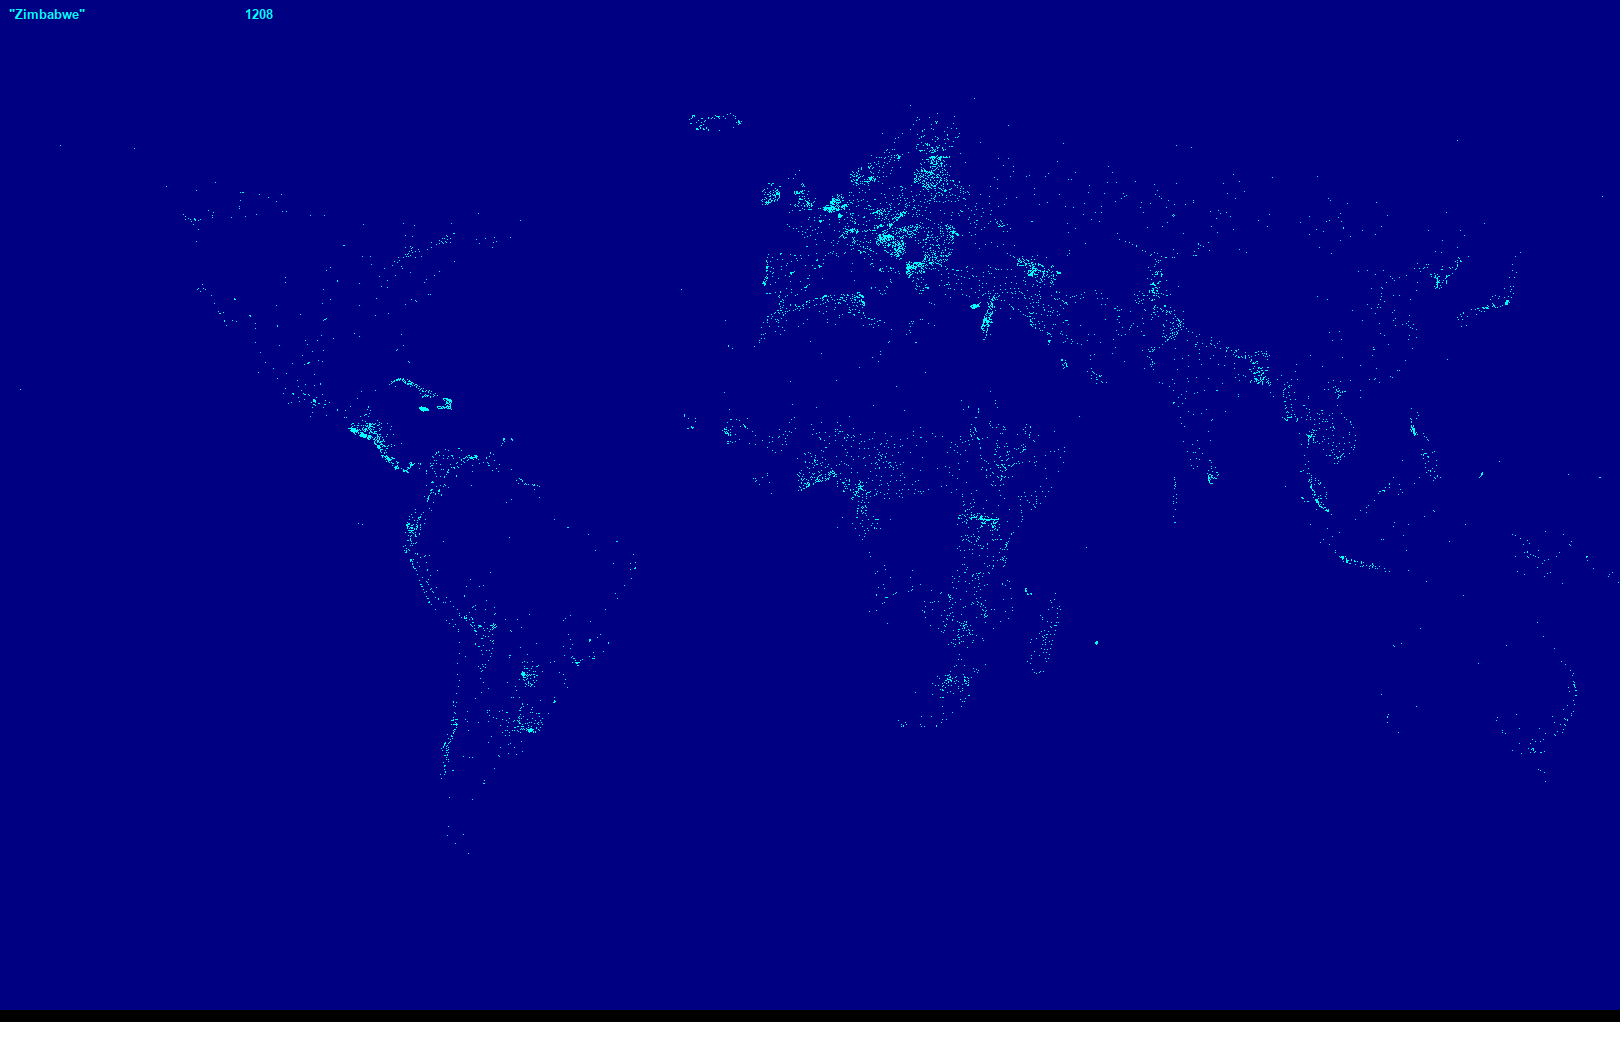
Recently I decided to repeat the exercise. It took about an hour to track down on the internet a table of lat/long/height data, and code a simple LB GUI to examine the data on a 1620x1040 graphic window.
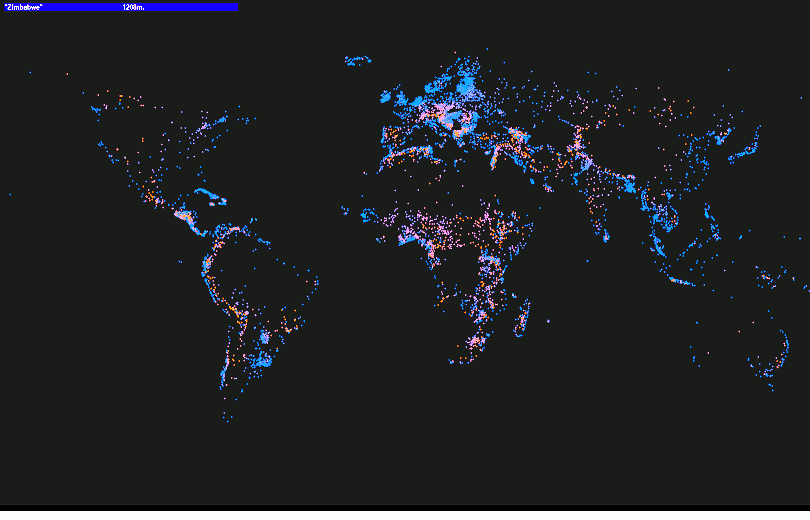
It is of course easy to see on the internet or Google Earth much more detailed displays, but the advantage of a d.i.y. approach is that you are in charge of what you want to display. For instance the second example output codes the cities to show their elevation.
The csv datafile looks like..
"1","Afghanistan","Kabul","34.5166667","69.1833344","1808.0"
"2","Afghanistan","Kandahar","31.6100000","65.6999969","1015.0"
"3","Afghanistan","Mazar-e Sharif","36.7069444","67.1122208","369.0"
"4","Afghanistan","Herat","34.3400000","62.1899986","927.0"
"5","Afghanistan","Jalalabad","34.4200000","70.4499969","573.0"
"6","Afghanistan","Konduz","36.7200000","68.8600006","394.0"
"7","Afghanistan","Ghazni","33.553555 ...........
 . . . . etc etc etc . . . . .
It is very easy to pick out the desired bits, and it works quickly and pleasingly. Oh to have had such fast and flexible possibilities when I was younger!
Then I started wondering about the more empty areas- USA/Canada or Amazon basin or Mongolia. Would be interesting to colour code by population.... However, since the file does not have that, I tried colour coding by elevation.
It is of course easy to zoom in to areas of interest to display at higher scale, which will separate the cities which are quite close together in many parts of the world. I'd also like to remap to a spherical globe viewed from a chosen location and altitude. Back to that old BYTE magazine for guidance!!
    nomainwin

    WindowWidth  =1820
    WindowHeight =1040

    open "Projection  of globe" for graphics_nsb as #wg

    #wg "trapclose quit"
    #wg "down ; fill 40 40 40 ; flush ; color cyan ; backcolor darkblue"
    #wg "size 3"

    open "cities.csv" for input as #fIn

    for i =1 to 10567
        line input #fIn, l$
        if l$ ="" then close #fIn: #wg "flush": wait

        '   in range -180 to 180
        section$    =word$( l$, 4, ",")
        L           =len( section$)
        lat         =val( mid$( section$, 2, L -1))

        '   in range - 90 to  90
        section$    =word$( l$, 5, ",")
        L           =len( section$)
        long         =val( mid$( section$, 2, L -1))

        section$    =word$( l$, 6, ",")
        L           =len( section$)
        elevn       =100 +val( mid$( section$, 2, L -1))

        #wg "up ; goto 10 20 ; down"
        #wg "color white"
        #wg "\"; word$( l$, 2, ","); "                                        "; elevn; "m.                         "

        if elevn >0 then
            R           =int( elevn /1000 *255)
            #wg "color "; str$( R); " 80 "; str$( 255 -R)

            #wg "set "; 810 +int( long /180 *900); " "; 520 -int( lat  /90 *550)
        end if

        scan
    next i

    #wg "flush ; getbmp scr 1 1 1620 1040"
    bmpsave "scr", "globe.bmp"

    wait

    sub quit h$
        close #fIn
        close #h$
        end
    end sub