Making 3D data accessible to human investigators!
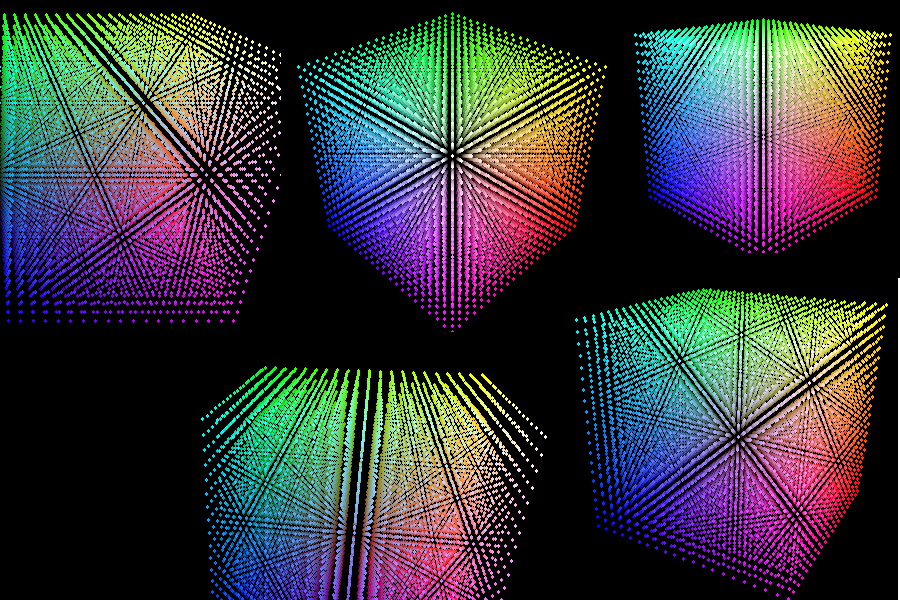
Humans find it easier to spot trends in 2D data if it is represented visually- what we call 'graphs'. Is it also the case in 3D? This is what caught my attention. Some of my results follow- the first is of a 'reactor core' where heat is generated centrally and diffuses out. The second is a collection of plays on viewing crystal lattices down close-packed planes.
A question on the forums about displaying 3D data ( about groundwater percolation) piqued my interest in this topic, which had been on my mind anyway. The hope was to present data which is calculated on a 3D lattice, in a visual way which helps human interpretation.
One of my 'wish-for's LB would be removal of the 2D-array limit. Anyway it can be worked round. The other problem is that it is easy to write functions that accept all the necessary parameters, but they only return one value. I wanted to feed in xyz and get our screnx and screeny.
My hope was to create a 2D screen representation, perhaps coding each lattice point with a circle of radius or colour representing each lattice point's magnitude ( with allowance for perspective). Then enable a user to 'fly round' and ideally through the grid, to resolve ambigities or hidden bits. This typically means calculating ( for a 10x10x10 grid) one thousand display objects. To ask LB/JB to update a 2D view of this as you scroll around it seemed imposssible in real-time, so I stitched results into animated GIFs. It worked fine, but by representing data as opaque objects, you get into trouble with 'screen z-ordering', ie objects may appear to be in front or behind others depending on the drawing order, and with a systematic scan of xyz space it is very hard to find this order- you'd have gto scan all grid locations, work out their screen locations, then compare with all other projected points to find the correct ordering! If you make the data 'points' large, they hide data behind them. If small, you can see through the lattice but seeing the colours (ie magnitudes) becomes very hard.... Oh well...
I then toyed with viewing the data as a 3D surface. This would need to calculate in effect a 3D 'equipotential' or contour of a given magnitude, and this would be at positions no longer on a regular grid- and could only represent one value. Perhaps you could 'pan' up and down this 'potential shape' to investigate- but it's beyond me at present.
After spending a lot of time inventing 3D display code, I realised that Steelweaver52 had been there before me. I copied his ScreenX and ScreenY routines. My solution to combining them- ( a problem he too had noted) I did by representing all screen x/y pairs as a SINGLE string variable, where the x and y values are separated by a space, and word$( is used to extract the two parts. I later found that KCDan also had combined them- in his case, by making them operate on global variable by using calling by reference.
I call the ( joined) function, as specified by Steelweaver52, with all the necessary parameters...
pxy$ =XY$( XX1, YY1, ZZ1,   CamX, CamY, CamZ,   CtrX, CtrY, CtrZ,   ScrCtrX, ScrCtrY,   Scale)
                sx1 =int( val( word$( pxy$, 1, " ")))
                sy1 =int( val( word$( pxy$, 2, " ")))
The combined function definition starts....
Function XY$( XX, YY, ZZ, CamX, CamY, CamZ, CtrX, CtrY, CtrZ, ScrCtrX, ScrCtrY, Scale)
...and ends..
    PX = (Ctr2ipX*virtualXi) + (Ctr2ipY*virtualXj) + (Ctr2ipZ*virtualXk)
    PY = (Ctr2ipX*virtualYi) + (Ctr2ipY*virtualYj) + (Ctr2ipZ*virtualYk)
    J1 = ScrCtrX + (SCM*Scale * PX)
    J2 = ScrCtrY - (SCM*Scale * PY)
    XY$ =str$( J1) +" " +str$( J2)
end function
... so TWO variables are available outside.
I've used my method for returning two values from a function elsewhere, to hold complex numbers in one variable, so the real and imaginary parts are always kept and processed together in my complex-number calculator. See Complexity.
I'm very happy with what I've got so far, but am yet to achieve all I'd like. Further help/ideas would be very welcome.