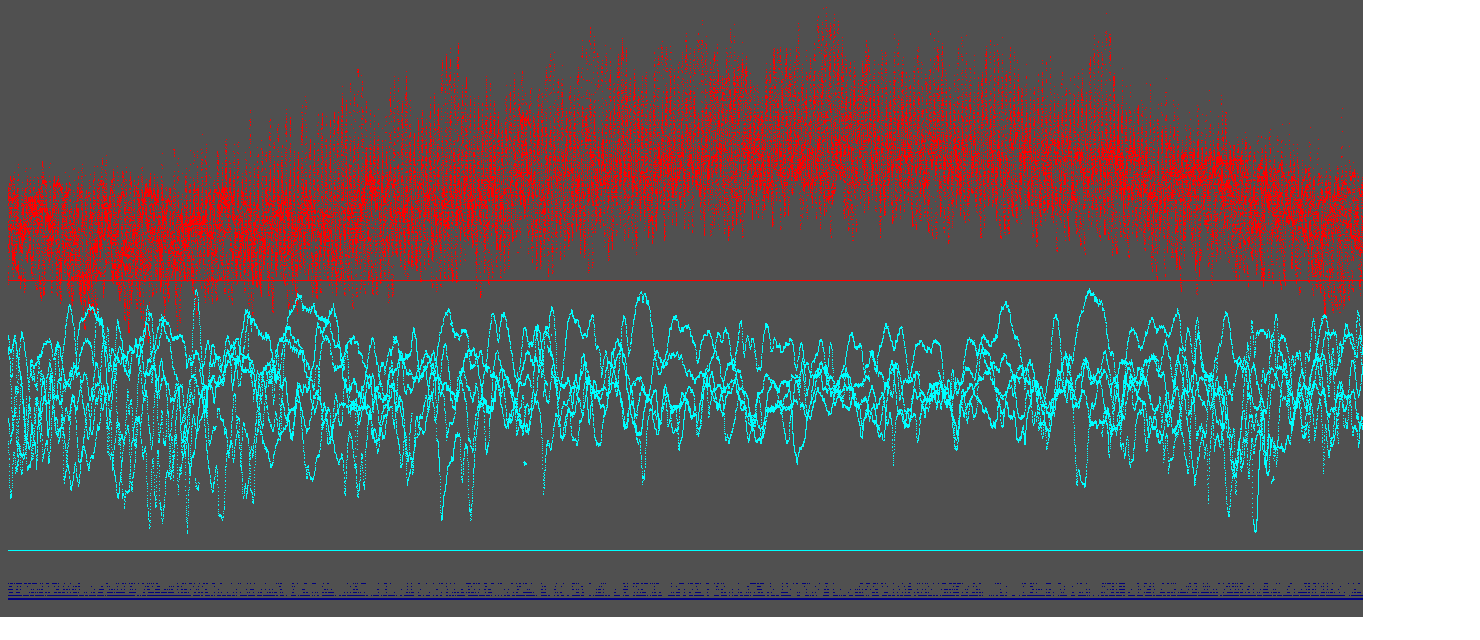
December to February have big pressure swings as depressions come in from the North Atlantic. Temperatures from late April to September are our 'summer', then a rapid drop in temperatures, but sub-zero ( Celsius) temperatures are rare and uually overnight.


The station saves data in the form of monthly files. I use 10 or 30 minute intervals usually. Also recorded are indoor temperature, outdoor humidity; wind direction and speed. Since the staion is close to a building and immediately above a dark-painted fence that gets full sun until mid afternoon the readings need to be 'taken with a pinch of salt', although consistent in themselves. It is possible to calculate cloud-base from the data- it is not directly measurable without access to lidar!
I'm interested in the periodicity of the depressions our trans-Atlantic cousins send towards the UK. Global warming seems to be giving us bigger extremes and less regularity through the seasons. I can plot things like daily temperature range, or time interval between successive depressions, or see if they correlate with the ( rather suspect) wind direction. And scope for unusual ( ?3D?) data presentations..
I used to download ( with LB from a website) a synoptic chart everyday. Unfortunately most modern sites use more sophisticated web frontends now which are harder to scrape.
By using LB I can very easily look at data over any chosen period. A typical program is shown- but I've used many variations.
Most of my data was on a 150G drive in a laptop, later re-purposed as an external drive. By a moments inattention- forgetting that Linux doesn't always use 'sba' for the external drive- I accidentally cloned a 8G Raspberry Pi image over the start of the drive. To recover data I had to use software that locates individual files, but doesn't know their names or types, unless that is, as with GIF, BMP, etc, encoded at the start-of-file. So I wrote various LB programs to identify my files via length, preamble or enclosed data. The remaining missing data is from battery change or other short episodes- or someone aiming a hosepipe at the rain sensor...
'   ********************************************
'   **********   cumulusYearGraphs.bas  ********
'   **********                          ********
'   **********      tenochtitlanuk      ********
'   **********        14/05/16         ********
'   ********************************************

'   Creates custom graphs from data saved by weather stations.
'   Station software updates a hard disk file whenever it is run,
'       or at regular intervals if left running.
'   This program reads, displays & saves data in ways the station prog. doesn't.
'   The images/files saved can be used on a web page since converted to gif.

    '   The file is of ASCII data in csv form, defined below.
    '1  Date in the form dd/mm/yy
    '2  Current time
    '3  Current temperature
    '4  Current humidity
    '       Current dewpoint
    '       Current wind speed
    '7  Recent (10-minute) high gust
    '8  Average wind bearing
    '9  Current rainfall rate
    '       Total rainfall today so far
    '11 Current sea level pressure
    '       Total rainfall counter as held by the station
    '       Inside temperature
    '       Inside humidity
    '       Current gust (i.e. 'Latest')
    '       Wind chill
    '       Heat Index

    '   Oct 2010 to May 2016

    '   To-dos:-
    '       Save the bmp's with appropriate names.

    nomainwin

    WindowWidth  =1500
    WindowHeight = 700
    UpperLeftX   =  20
    UpperLeftY   =  20

    graphicbox #w.gb,               0, 55, 1480, 640
    statictext #w.st,  "filename", 10, 02, 1100,  16
    statictext #w.st2, "dateTime", 10, 25, 1100,  16

    open "Cumulus datafile reader for all months" for window as #w

    #w.gb "trapclose quit"

    #w.gb "size 1"
    #w.st "!font courier 12"

    monthName$      ="Jan Feb Mar Apr May Jun Jul Aug Sep Oct Nov Dec"
    monthLen$       ="31 28 31 30 31 30 31 31 30 31 30 31"
    '   ______________________________________________________________________
    for year =10 to 16                                                  '   data for years 2010 to 2016...
        #w.gb "cls"
        for month =1 to 12
            skip =0
            if year =10 and month <10 then skip =1: goto [bypass]
            if year =16 and month > 5 then skip =1: goto [bypass]
            '    #w.gb "up ;   goto "; xd; "   0 ; down ; color yellow ; goto "; xd; " 640 ; up ; goto "; xd; " 610 ; color black"
            name$       =word$( monthName$, month, " ") +str$( year)
            fn$         =name$ +"log.txt"
            #w.st fn$;

            open fn$ for input as #file
              [data]
                line input #file, row$                                  '   Extract row of 11 data items.

                date$       =word$( row$, 1, ",")                       '   Extract date and separate into d/m/y.
                days        =val( mid$( date$, 1, 2))
                months      =val( mid$( date$, 4, 2))
                years       =val( mid$( date$, 7, 2))

                tim$        =word$( row$, 2, ",")                       '   Extract time and separate into hrs/mins.
                hrs         =val( mid$( tim$,  1, 2))
                mins        =val( mid$( tim$,  4, 2))
                minutes     =mins +60 *( hrs +24 *days)                 '   Calc. minutes since day start.

                yearDay      =days +hrs /24
                for cnt =1 to months -1
                    yearDay =yearDay +val( word$( monthLen$, cnt, " "))
                next cnt
                if years mod 4 =0 and months >1 then yearDay =yearDay +1

                xPos =10 +int( 4 *yearDay)

                #w.st2 date$; " "; tim$;

                T           =val( word$( row$,  3, ","))                '   outside temperature in rough range   0 -->  25
                #w.gb "color red ; up ; goto "; xPos; " "; 280 -T *8
                #w.gb "down ; goto "; xPos; " 280"

                P           =val( word$( row$, 11, ",")) -990           '   atmospheric pressure         range 990 -->1040
                #w.gb "color cyan ; up ; goto "; xPos; " "; 440 -P *3
                #w.gb "down ; goto "; xPos; " 550"

                R           =val( word$( row$,  9, ","))                '   rainfall rate                range   0 -->   3
                #w.gb "color darkblue ; up ; goto "; xPos; " ";  598 -R *5

                #w.gb "down ; goto "; xPos; " 599"

                scan

                if skip =1 then [data]
                if skip =0 and not( eof( #file)) then [data]

            close #file

          [bypass]
        next month

        #w.gb "flush"
        #w.gb "getbmp scr 0 0 1480 640"
        pfb$        =str$( year) +"X.bmp"

        'bmpsave "scr", pfb$
        unloadbmp "scr"

        'timer 5000, [continue]
        'wait
      [continue]
        'timer 0
    next year
    '   ______________________________________________________________________
    wait

sub quit h$
    close #h$
    end
end sub