Tide Prediction

 -
-  -
- 

 -
-  -
- 
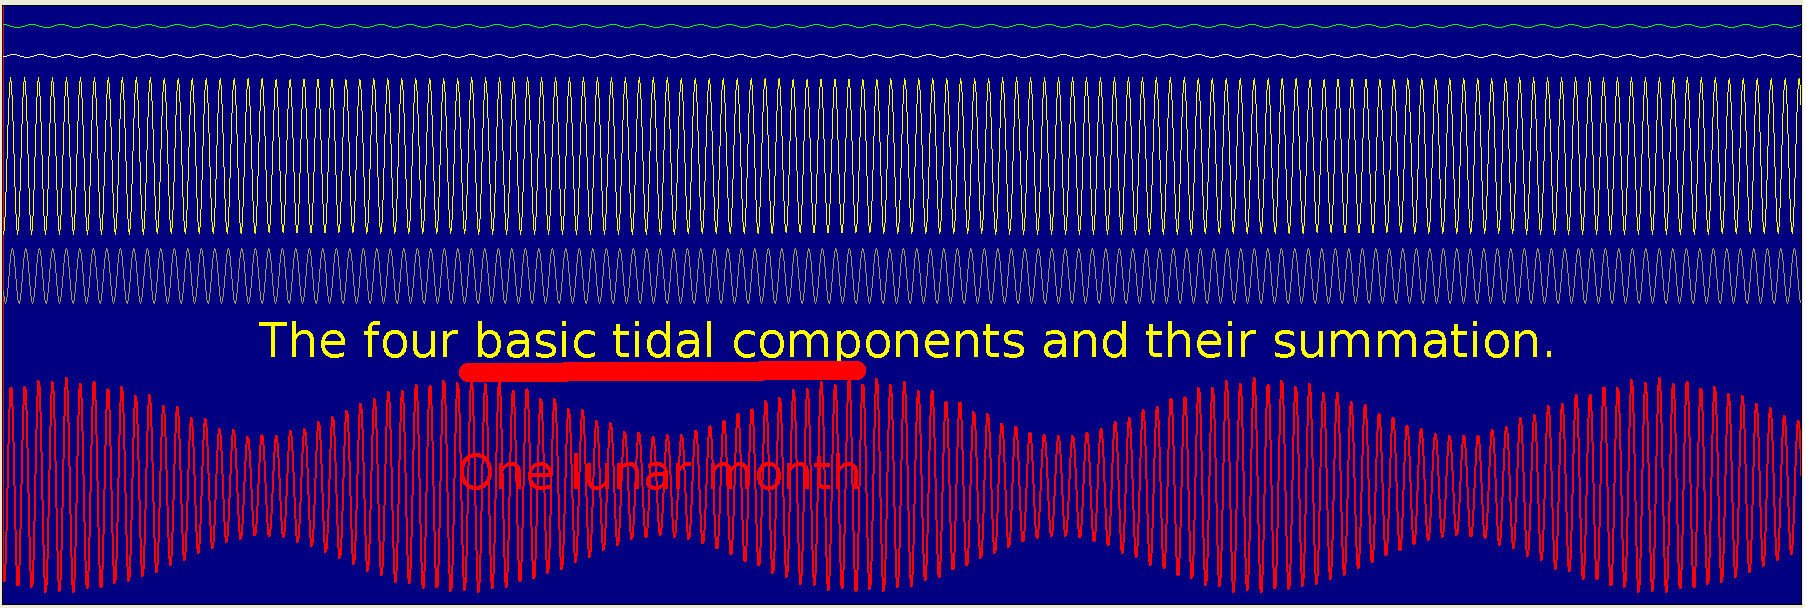
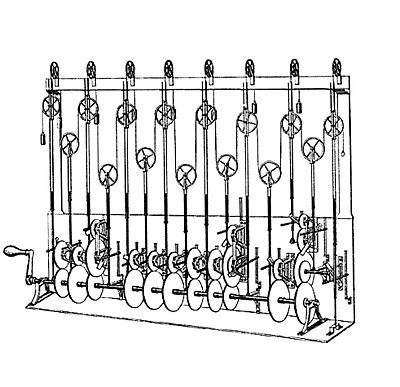
Tides are a mixture of the predictable and the random. The latter include atmospheric pressures and winds, and river levels. And the predictable part ( ie loosely the astronomical components) have frequencies not in simple ratios to each other. All therefore related to Fourier analysis/synthesis, but noticeably more complex. The mechanical solution and the compter one both implement the summation of these terms of different frequency, phasing and amplitude.
In most locations, the largest constituent is the "principal lunar semi-diurnal", also known as the M2 (or M2) tidal constituent. Its period is about 12 hours and 25.2 minutes, exactly half a tidal lunar day.
Approximately twice a month, around new moon and full moon when the Sun, Moon, and Earth form a line (a condition known as syzygy) and the tidal force due to the sun reinforces that due to the Moon. The tide's range is then at its maximum; this is called the spring tide. It is not named after the season, but, like that word, derives from the meaning "jump, burst forth, rise", as in a natural spring.
The solar tidal force is 46% as large as the lunar. The theoretical amplitude of oceanic tides caused by the moon is about 54 centimetres (21 in) at the highest point, which corresponds to the amplitude that would be reached if the ocean possessed a uniform depth, there were no landmasses, and the Earth were rotating in step with the moon's orbit. f both the sun and moon were at their closest positions and aligned at new moon, the theoretical amplitude would reach 93 centimetres (37 in). Real amplitudes differ considerably, not only because of depth variations and continental obstacles, but also because wave propagation across the ocean has a natural period of the same order of magnitude as the rotation period: this makes resonance effects particularly important.
In the UK recently we've been having exceptional rain ( hence floods) and winds. This has led to spectacular coastal flooding... In the UK we are particularly aware of our coastline, since all of England's locations are within about 100miles of the sea, and we experience all the gales the jet stream can throw at us off the Atlantic.
The code here was thrown together just to get a feel for how it works. The site data is for Hinkley Point, a seashore site holding one nuclear reactor currently working; one being decommissioned and dismantled; and one due to start construction shortly. The site is right next to the Severn Estuary ( 10m tides- one of the biggest in the world) and the Somerset Levels ( 50 square miles or so are currently under water). Still. probably one of the safer forms of power generation at present!!
The 28 day lunar cycle shows clearly, and the two daily tides.
' Tidal variations can be represented by summing a series of harmonic terms.
'     Listed below are the four largest harmonic constants (or tidal constituents) M2, S2, O1 & K1 together with the mean value Z0.
'     Each harmonic term has the form:
'                H( n) *cos( sigma( n) *t - g( n))

'     H( n)      is an amplitude in metres
'     g( n)      is a phase lag on the Equilibrium Tide at Greenwich in degrees
'     sigma( n)  is an angular speed
'     t is time.

' Hinkley Point
' mean value       Z0 =6.235
' First four harmonic parts:-
' O1        H =0.073      g =355.95 lunar diurnal,                                       ??speed 13.9430356 degrees/hour???
' K1        H =0.069      g =134.72 lunar diurnal                                        ??speed 15.0410686???
' M2        H =3.915      g =182.40 principal lunar semidiurnal, 2 cycles per lunar day, ??speed 28.9841042???
' S2        H =1.402      g =236.50 principal solar semidiurnal,                         ??speed 30???

nomainwin

WindowWidth  =1825
WindowHeight =660

graphicbox #w.gb, 10, 10, 1800, 600

open "Tide predictor" for window as #w

#w "trapclose [quit]"
#w.gb "down ; fill darkblue"

tMax =1600

data 0.073,   355.95,   13.9430356
data 0.069,   134.72,   15.0410686
data 3.915,   182.40,   28.9841042
data 1.402,   236.50,   30

for i =1 to 4
    read d: H( i)     =d
    read d: g( i)     =d
    read d: sigma( i) =d
next i

oldX     =  0
oldY( 0) =  0
oldY( 1) = 50: col$( 1) ="green":         offset( 1) = 20
oldY( 2) =150: col$( 2) ="white":         offset( 2) = 50
oldY( 3) =150: col$( 3) ="yellow":        offset( 3) =150
oldY( 4) =250: col$( 4) ="160 150 90":    offset( 4) =270

for t =0 to tMax step tMax /1800
    height =0
    for n =1 to 4
        hNext =H( n) *cosD( sigma( n) *t - g( n))
        #w.gb "down ; size 1 ; color "; col$( n)
        #w.gb "line "; oldX; " "; oldY( n); " "; t /tMax *1800; " "; offset( n) -hNext *20
        #w.gb "up"
        oldY( n) =offset( n) -hNext *20
        print using( "##.#####", hNext); " ";
        height =height +hNext
    next n
    print "   ";
    print t, height
    '#w.gb "set "; t /tMax *800; " "; 480 -height *20
    #w.gb "down ; size 2 ; color red ; line "; oldX; " "; oldY( 0); " "; t /tMax *1800; " "; 480 -height *20; " ; up"
    oldX      =t /tMax *1800
    oldY( 0)  =480 -height *20
next t

#w.gb "flush"

wait

function cosD( theta)
    cosD =cos( theta *3.14159265 /180)
end function

[quit]
close #w
end