Simple Turtle Graphics a la LOGO.
nomainwin
'Simple turtle graphics
'Create a function that uses turtle graphics to draw a house of a specified size.
'Create a function that takes a list of non-negative numbers and draws a bar chart from them, scaled to fit a square of a specified size.
WindowWidth = 1000
WindowHeight = 600
open "Turtling" for graphics_nsb as #wg
#wg "down ; size 1 ; down ; fill 50 50 50 ; color cyan ; home ; up ; flush"
#wg "trapclose quit"
for i =30 to 250 step 50
call house 20 +i /10, i *2, 100 +i
next i
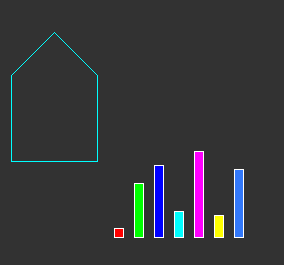
global data$: data$ ="10,55,73,27,87,23,69"
dim barLength( 100) ' globally available
dim col$( 10)
col$( 1) ="red"
col$( 2) ="green"
col$( 3) ="blue"
col$( 4) ="cyan"
col$( 5) ="pink"
col$( 6) ="yellow"
col$( 7) ="50 120 250"
col$( 8) ="120 50 250"
col$( 9) ="250 50 120"
col$(10) ="50 250 120"
call barChart data$, sqSize, 500, 450
wait
sub barChart d$, sqSize, x, y
numBar =1
do
nxt =val( word$( data$, numBar, ","))
if word$( data$, numBar, ",") ="" then exit do
barLength( numBar) =nxt
numBar =numBar +1
scan
loop until 0
#wg "color white"
for j =1 to numBar
#wg "backcolor "; col$( j mod 10); " ; up ; goto "; x +20 *j; " "; y; " ; down ; boxfilled "; x +20 *j +10; " "; y -barLength( j)
next j
end sub
end
sub quit h$
close #h$
end
end sub
sub house l, x, y
#wg "home ; goto "; x; " "; y
#wg "north ; turn 180"
#wg "go "; l
#wg "turn 90"
#wg "down"
#wg "go "; l
#wg "turn 90"
#wg "go "; 2 *l
#wg "turn 45"
#wg "go "; l /cosRad( 45)
#wg "turn 90"
#wg "go "; l /cosRad( 45)
#wg "turn 45"
#wg "go "; 2 *l
#wg "turn 90"
#wg "go "; l
#wg "up; home ; north"
end sub
function cosRad( th)
cosRad =cos( th *3.14159265 /180)
end function