Processing 2D elevation data- sea level rise.
Watch the animation as the sea rises a metre each frame...
Watch the animation as the sea rises a metre each frame...
I use my technique of scanning colour-coding from a bitmap, so it is incredibly easy to experiment with other colour schemes.

I've further ideas to try, about making plots of STEEPNESS of slopes, rather than absolute heights, for example. And I want to overlay semitransparent mapping data- roads, rivers...
The animation is automagically produced by ImageMagick from within Liberty, as usual.
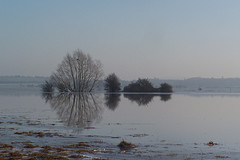
It happens that for the last five weeks we have had severe flooding, and much of the land in the 1 to 2m zone is currently swampy or actually flooded. It was very pretty before Xmas when the edges froze... but the main road from Taunton to Gladstonbury has been impassable for five weeks. Avalon is an island again, almost! King Alfred hid in these areas from the Danes...
 -
- 
Photos available on my Flickr site!
nomainwin

'   57,600,000 bytes. 20km square at 50m intervals. 2-byte, hi-lo, signed data.
'   Data is in 5 bytes of ASCII representing nnn.n metres. Space separator.
'   After 401 values, ( 0d 0a) separates rows.

global dataFile$
dim colour$( 256)

UpperLeftX   =  80
UpperLeftY   =  50
WindowWidth  = 420
WindowHeight = 500

open "Display data" for graphics_nf_nsb as #w

#w "trapclose [quit]"

loadbmp "lookup", "spect.bmp"
#w "down ; fill black ; drawbmp lookup 20 450 ; flush"
indy =5 '   vertical drop to colourbar required
for indx =0 to 255
    colour$( indx) =GetPixel$( 2 +19 +indx, 450+indy)
next indx

'data "st\ST00"
'data "st\ST02"
'data "st\ST04"
'data "st\ST20"
data "st\ST22"
'data "st\ST42"
'data "st\ST44"
'data "st\ST24"
'd\ta "sy\SY08"
'data "sy\SY28"
'data "finished"

read mapSquare$

for rise =0 to 10
        open "DTM\ASCII\data\" +mapSquare$ +".asc" for input as #fileIn
            dataFile$ =input$( #fileIn, lof( #fileIn))
        close #fileIn
        index =72
        CRLF$ =chr$( 13) +chr$( 10)
        for y =0 to 400
            for x =0 to 400
                z$ =""
                do
                    z$ =z$ +mid$( dataFile$, index, 1)
                    index =index +1
                loop until right$( z$, 2) =".0"
                if mid$( dataFile$, index, 1) =" "   then index =index +1
                if mid$( dataFile$, index, 2) =CRLF$ then index =index +2
                z  =int( val( z$) *255 /450)
                if val( z$) >rise then
                    #w "color "; colour$( z)
                else
                    #w "color black"
                end if
                #w "set "; 2 +x; " "; 2 +y
                'print index,, x, y, z$
            next x
            scan
        next y
        #w "flush"
        #w "getbmp scr 2 2 402 402"
        bmpsave "scr", "outRaised\map" +right$( mapSquare$, 4) +"_" +str$( rise) +".bmp"
        #w "down ; cls ; fill black ; flush"
next rise

wait

[quit]
close #w
end

function GetPixel$( x, y)                               'x, y = window coordinates     Thanks KCDan!!
        #w "getbmp pixel ";    x; " "; y; " 1 1"        'A 1x1 bitmap, contains exactly 1 pixel
        #w "color white ; set "; x; " "; y
        bmpsave "pixel", "PixelData.dat"                'Save that one pixel as a temporary bmp file
        open "PixelData.dat" for binary as #kc          'Open that one pixel bmp file as a binary file
            seek #kc, 66                                'Blue Info
            b =asc( input$( #kc, 1))                    'Blue
            Seek #kc, 67                                'Green Info
            g =asc( input$( #kc, 1))                    'Green
            Seek #kc, 68                                'Red Info
            r =asc( input$( #kc, 1))    'Red
        close #kc
        kill "PixelData.dat"                            'Delete the temporary bmp file
        GetPixel$ =r; " "; g; " "; b                    'Place the values in a string
end function