Why is your supermarket queue always the slowest?

Suppose a small bank has only one teller. They are open 24 hrs per day, so three shifts operate.
Customers take an average of 10 minutes to serve and they arrive at the rate of 5.8 per hour, ie on average about 10.35 minutes apart.
What will the expected waiting time be? Does it reach a steady state, and how quickly?
We assume customer arrivals -and customer service times- are random.
It turns out that on average customers will have to wait nearly five hours before they are served.
Now, realize the same calculation applies to multiple people accessing a hard drive. While it may be fast enough for single users and their jobs, if being accessed above 50% of the time by SOMEONE, you may experience BIG delays!
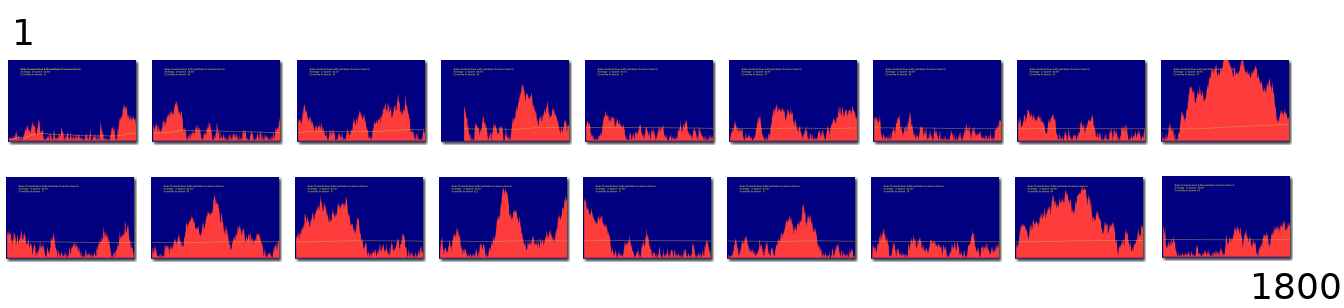
Here's the result of simulating the situation for a 5.85/hour rate. My code draws the situation a screen at a time over thousands of hours. There is an increasingly steady 'average', but bigger than expected, and bursts can carry you down to zero queue ( immediate serving!) or up for some unlucky, very high, delays.
The situation is modelled by 'exponential distributions'. We are used to throwing random numbers with equal probability across a range. We also quite often need say a 'bell curve' normal distribution. But by exponential we mean that for all possible delays from zero to infinity, the chance gets exponentially lower that we have not yet been served or completed the transaction. We arrange for the average of these declining 'probabilities of greater and greater times' to be our desired average.
As I often do, I'll not add the code here for a few days- if you enjoy learning new bits of maths I won't spoil it by giving the details. You'll find details via Google, because queuing theory is a very important area in things like networks and logistics. Nice references include Phreshing blog and Kottke
It is a good idea to test your distribution routine to check that if called say a million times, the average delay is indeed the desired one!
As a hint, don't add a graphical interface at first. To get 18 screens took several hours. And because I kept writing text to the screen I kept crashing LB with all the saved redraw information!