Distributions and k-mean associations
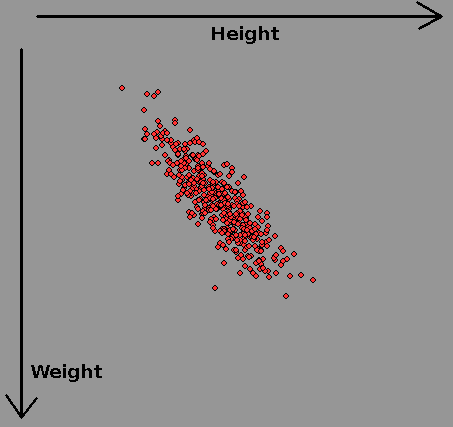
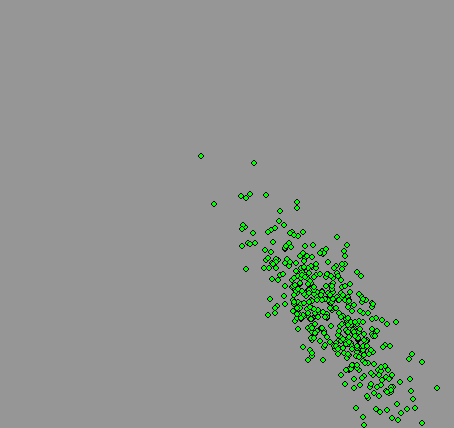
In a survey of women's heights and weights the above datapoints were recorded. Each axis is said to be 'normally distributed' with a mean ( average) and a variance/standard deviation describing how it tails off at more extreme departures from the mean. When repeated for men, there is a new mean height and weight, and significant overlap.
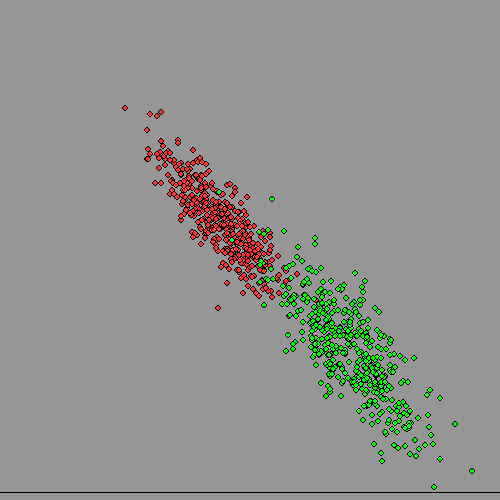
Now lets plot both at once, and assume we have lost the information on subject's gender. Can we get it back, given there is significant overlap? It turns out to be surprisingly troublesome for a computer, but quite easy for a human, but also surprisingly useful to do this kind of thing. It could allow an advertising team to identify who to address their efforts to if their product was more appropriate to one sex than the other, even if data-protection laws made it impossible for them to hold data on gender.
In real life this becomes what is called data-mining. The number of numerical parameters used would be much bigger ( not just two like we used) and the dataset might have millions of entries. VERY computer intensive..
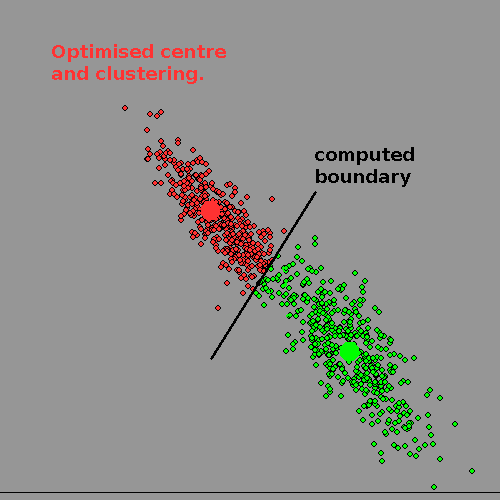
Clearly a diagonal boundary can split MOST of the 'women' from the 'men' on the third diagram, but there will be mistakes at the boundary because of the overlap. Only if the clusters have NO overlap can human or machine 'get it right'.
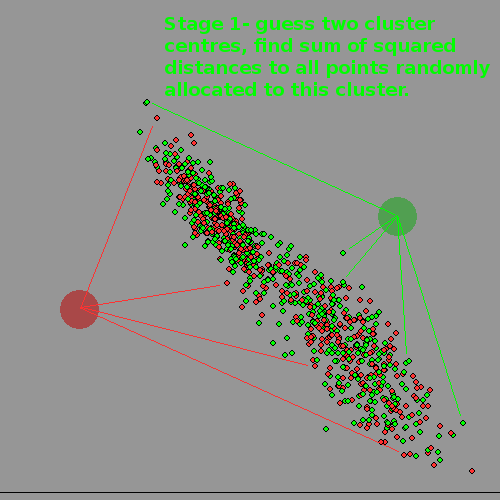
k-means algorithm
The algorithm for a computer ( we don't KNOW how a human brain can do this kind of things so easily) is to first decide how many clusters there ARE, chose a well-separated 'centre' for each, and then allocate each datapoint at random to one or the other.
Now find the centre-of-gravity /centroid of each cluster by finding the Euclidean distance, ie sum squares of distances and move its notional centre to this point.
Now we enter a loop where we swap a datapoint at random to the other /another cluster and see if this reduces the the Euclidean total distance. If so we accept the change and calculate the two altered centroids with this one changed datapoint. If not, we re-instate it and try another.
We repeat this until there is no improvement. It is obviously a LOCAL minimum, but may NOT be the optimal solution. The best we can do about this is to try the whole process again with new random starting cluster centres, and comparing each run.
 - -
- -
Real life
Some early work in this area was done by my namesake R Fisher, who used gathered data on iris plants growing on the Gaspe Peninsula. He knew there were three species present, and the gathered data included petal width and length, sepal width and length, etc. Would it be possible to deduce species from just this numerical data? It turns out two species overlapped too much to separate numerically, but the third was separable. The data set is still often used in demonstrations.
Coding this..
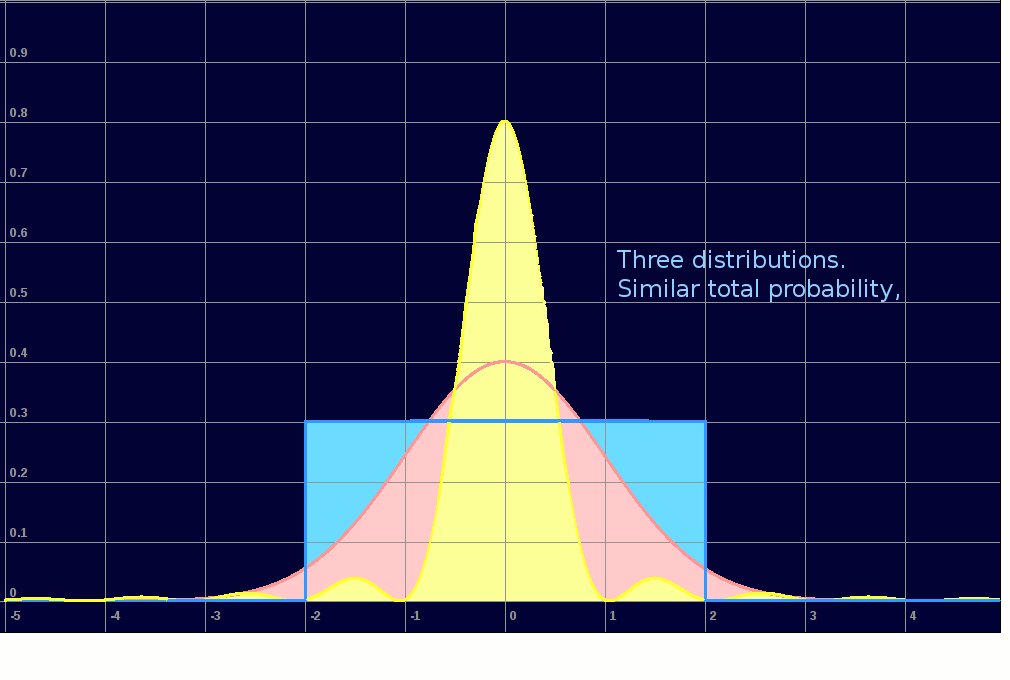
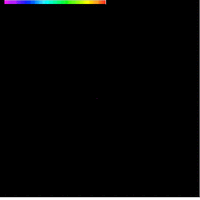
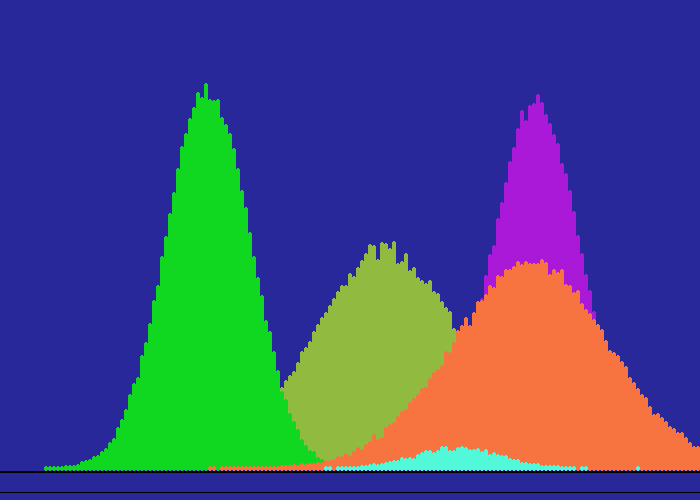
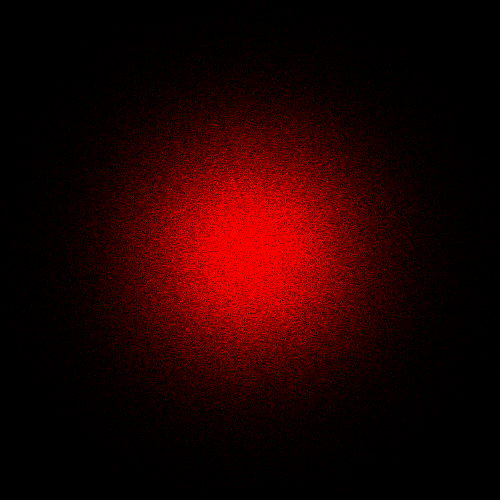
I first had to decide how to throw 'normally distributed random numbers'. We often use random numbers spread uniformly across a range, but most situations in the real world are 'bell curve', ie near 'normal'. Then I could invent datasets which did or did not overlap and implement the algorithm. I 'throw' random x/y coordinates according to one of three distributions. If a point is hit again, its colour moves up the spectrum. Note the use of a spectrum-palette to show increasing numbers of 'hits' on each data point, more effective than simply fading up one colour.
Some of the graphic output is shown below- some as animations.
 -
-
 -
-
See k-means and Iris data set on Wikipedia.
(LB programs will be put up soon as a zip file.)
Normal-distribution code ( see also Rosetta Code)
normalVariable =mean +sd *( sqr( -2 * log( rnd( 0))) * cos( 2 * pi * rnd( 0)))