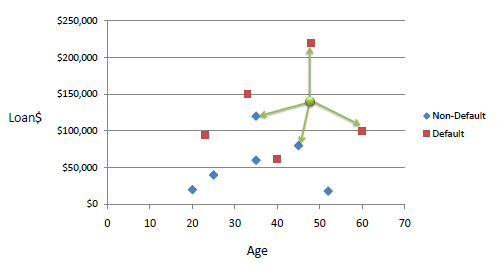
Suppose you have collected historic data in a database on something like applicants for loans. You know for each one whether they defaulted or not, and know their annual income and size of the loan. There is no calculation of risk for a new customer to end in default, but you can use the data to make an intelligent guess. Basically, look for a (small) number of previous cases- typically one to ten- that are 'nearby' in the search space, ie have nearly the same income and loan size. If the majority of them do NOT default, then you can have some confidence that your new customer will not default. Basically you are using your experience of similar cases.
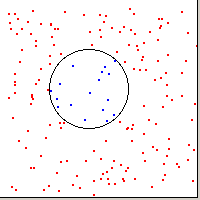
'bluatigro' raised the topic on the LB forum, and this is my 'take' on the situation. Our examples assume each candidate is identified by two parameters ( but it could be more). You find the ( Pythagorean) distance to all the existing examples- I used 200- and find the 'K' nearest ones to do a majority vote. Note it is NOT even wighted to make near-neighbours more relevant. Bluatigro used the mouse pointer to select a parameter-pair and display a notice of what the algorithm decided. My adaptation scans all possible parameter-pairs and maps the decisions.
Now we decide on a value of K.
The following animation shows the results of choosing K from one to eight. It will never create the perfect distribution unless given an infinite number of historic parameter-pairs. Of course with 'real' data the shape will not be a simple geometric on- if it were, we could directly calculate whether we were inside/outside!
The code presented here handles the case of two dimensions, which we can helpfully show on a 2D screen. The program easily extends to more dimensions, but there will no longer be any way to 'visualise' it except as projections onto a 2D screen.
For many dimensions and large data-sets the technique becomes slowed by the many calculations! In the first animation all data points are valid- no random noise- and I choose to show the cases of red and blue neighbours being equal as Blue. In the next example I show the three regions as three colours, using magenta for the region the algorithm sees as having equal neighbours of the two types.
This second animation shows the effect of random 'contrary' data values. Note also that in this one I show the three states of predicting Red, predicting Blue, and 'can't make up my mind'!
    '   In pattern recognition, the k-Nearest Neighbours algorithm
    '       (or k-NN for short) is a non-parametric method used for
    '       classification and regression.

    '   The input consists of the k closest training
    '       examples in the feature space.

    '   In k-NN classification, the output is a class membership.

    '   An object is classified by a majority vote of its neighbors,
    '       with the object being assigned to the class most common
    '       among its k nearest neighbors (k is a positive integer,
    '       typically small).

    '   If k = 1, then the object is simply assigned to the class
    '    of that single nearest neighbor.

WindowWidth  = 500  '   DisplayWidth
WindowHeight = 270  '   DisplayHeight
UpperLeftX   =  20
UpperLeftY   =  20

winx         = 200
winy         = 200

dim p( 1000, 2), distSq( 1000, 2)

nomainwin

graphicbox #m.gb1, 10, 10, 200, 200
graphicbox #m.gb2,270, 10, 200, 200

statictext #m.st1, "", 230, 30, 30, 20

open "K NEAREST mapping." for window_nf as #m
  #m "trapclose [quit]"
  #m.gb1 "fill 220 220 80 ; up ; goto 90 90 ; down ; circle 40 ; up ; flush"
  #m.gb2 "fill 220 220 80 ; flush"

  for i = 0 to 200
    x           = rnd( 0) * winx
    y           = rnd( 0) * winy
    p( i, 0)    =x
    p( i, 1)    =y
    '   data held in p() array as 'x, y, k'. Would normally be field-collected data.
    '   Here I use a circle radius 40 centre ( 80, 80) plus ( optionally) random color swaps of 20 per cent of all points.
    if ( x -80)^2 +( y -80)^2 >1600 then
        p( i, 2) =1
        'if rnd( 1) <0.1 then p( i, 2) =0
    else
        'if rnd( 1) <0.1 then p( i, 2) =1
    end if


    #m.gb1 "goto "; 10 +x; " "; 10 +y
    #m.gb1 "down"

    if p( i, 2) then
      #m.gb1 "color red"
      #m.gb1 "backcolor red"
    else
      #m.gb1 "color blue"
      #m.gb1 "backcolor darkblue"
    end if

    #m.gb1 "circlefilled 1"
    #m.gb1 "up"
  next i

  #m.gb1 "flush ; down"

  #m.gb1 "getbmp scr 1 1 200 200"
  bmpsave "scr", "dataPoints.bmp"

#m.gb2 "size 2 ; down"

K =0

[around]
'#m "up ; goto 240 20 ; down ; backcolor white ; color darkred"
'#m "\K="; K +1
'#m "up"
#m.st1 "K="; K +1

for x =0 to winx step 4
    for y =0 to winy step 4
    scan

    for i =0 to 200
        distSq( i, 0) =distanceSq( x, y,      p( i, 0), p( i, 1))
        distSq( i, 1) =i
    next i

    sort distSq(), 0, 100, 0

    red  = 0
    blue = 0

     for i = 0 to K                         '   this is the number K ( minus 1) of neighbours to look for
        if p( distSq( i, 1), 2) =1 then                 '   using K of 8 here. Try other values.....
            red  = red  + 1
        else
            blue = blue + 1
        end if
        if red >=blue then  #m.gb2 "color 255 80 80" else #m.gb2 "color 80 80 255"
    next i

    #m.gb2 "size 4 ; set "; x +2; " "; y

    next y
next x

#m.gb2 "flush"

timer 5000, [moveOn]
wait
[moveOn]
timer 0

#m.gb2 "getbmp scr 1 1 200 200"
bmpsave "scr", "kNearest8a_" +str$( K +1) +".bmp"
K =K +1
if K <=8 then [around]

wait

function distanceSq( a, b,      c, d)
    distanceSq = ( a -c )^2 + ( b -d )^2
end function

[quit]
    close #m
    end