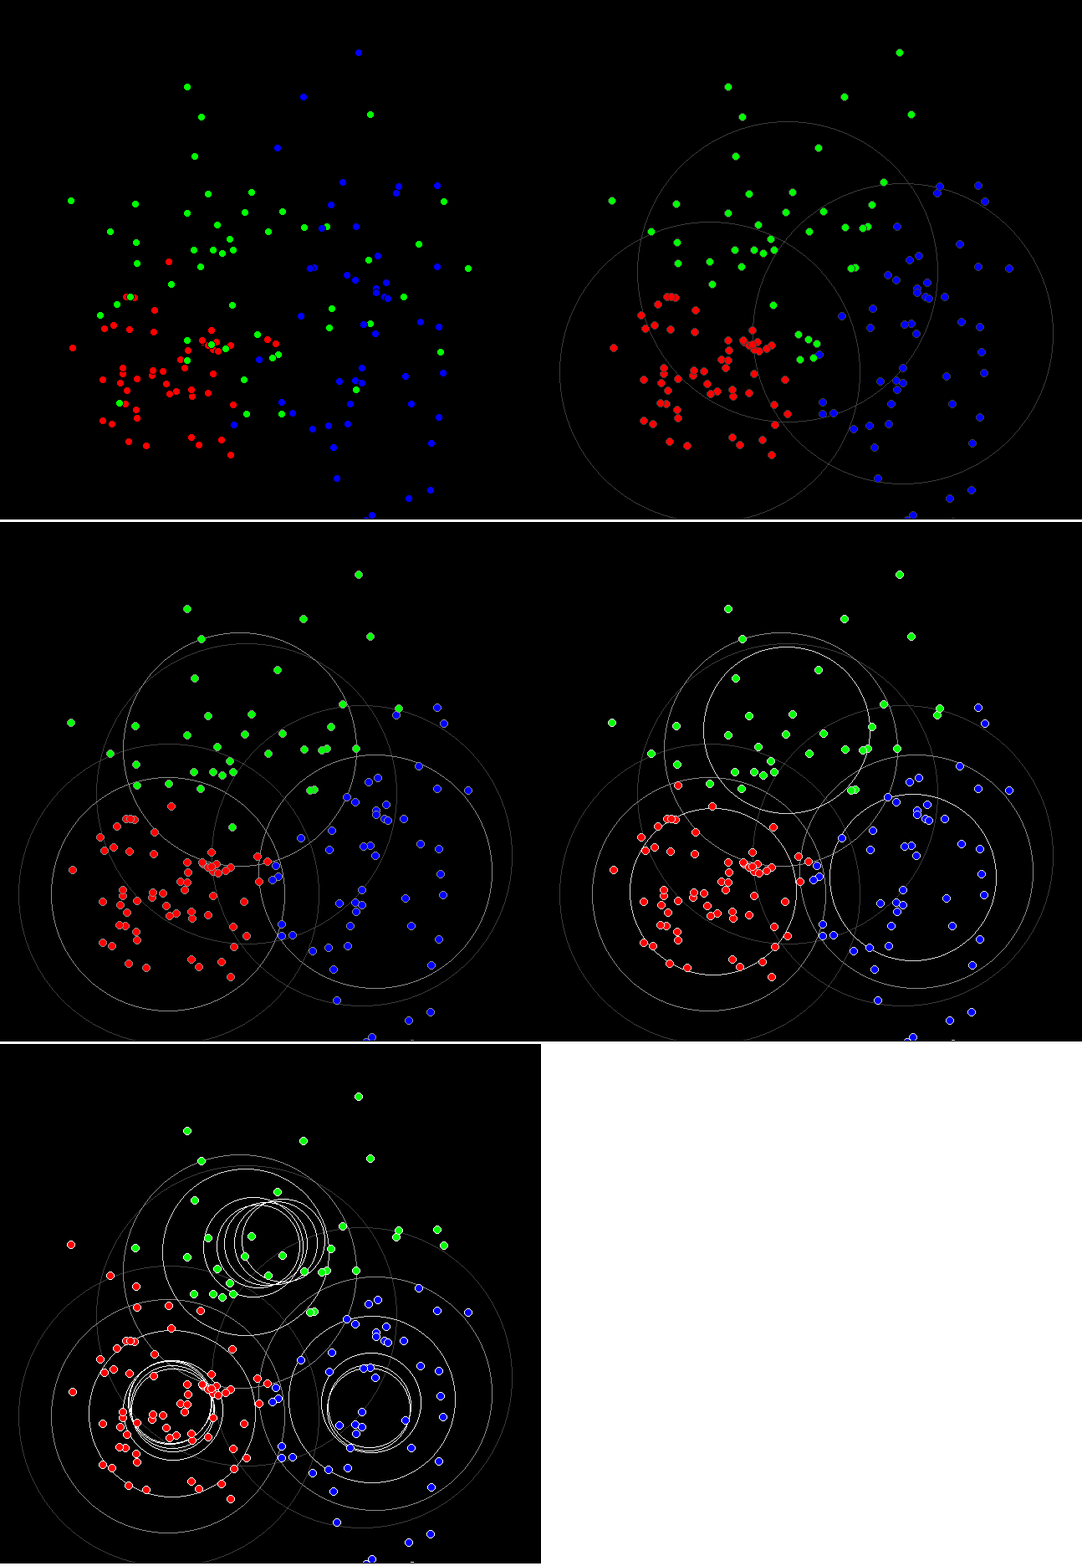
k-means. Detecting clusters in 2 ( or more) dimensioned data.
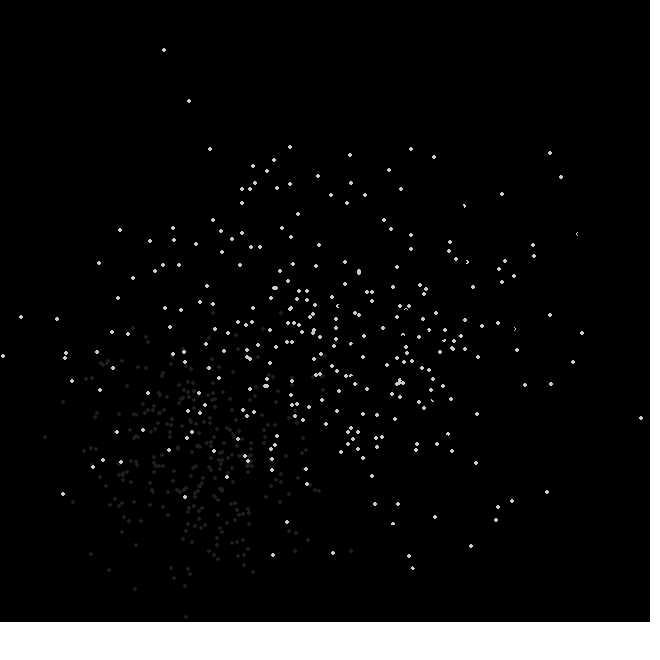

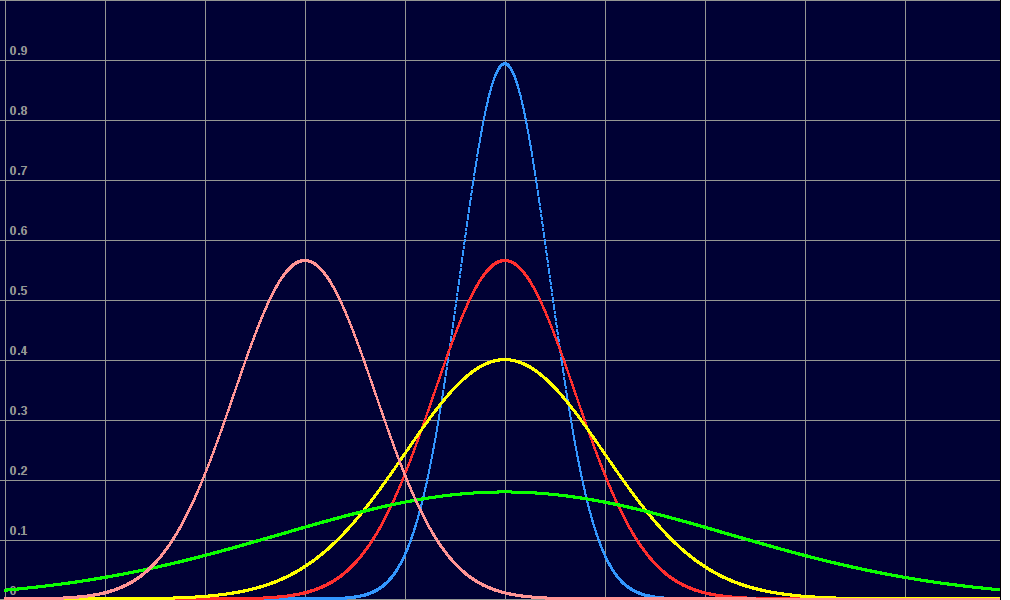
For the above 2-D data we might guess that the distribution is 'normal. We calculate mean and SD, and can use them to predict.
BUT we night think that the data actually represents TWO superposed normal distribution. Female weight/height won't cluster with the same mean/SD. Can we detect this? And what if we know that there is a large fraction of population with different ethnic origins. Can this be seen?
Basically, if this extra dimension has not been gathered with the data all we can do is try to group the data into non-overlapping regions. If a new datum is measured, we then have better chance of predicting whether the individual was male, female, etc.
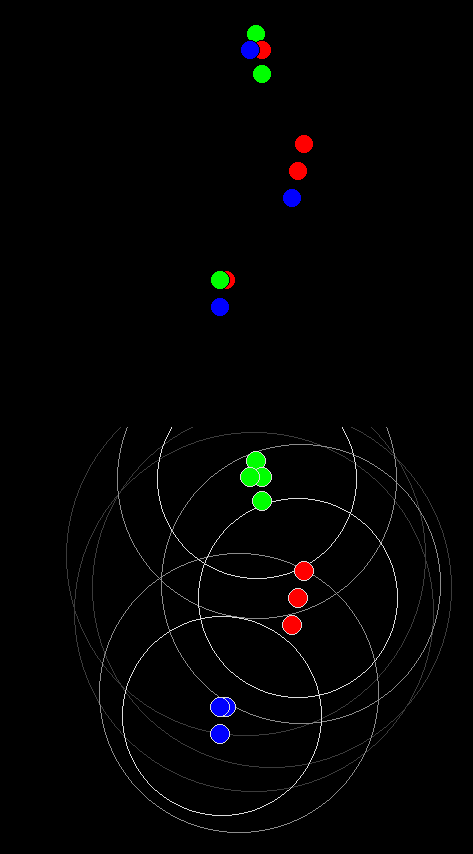
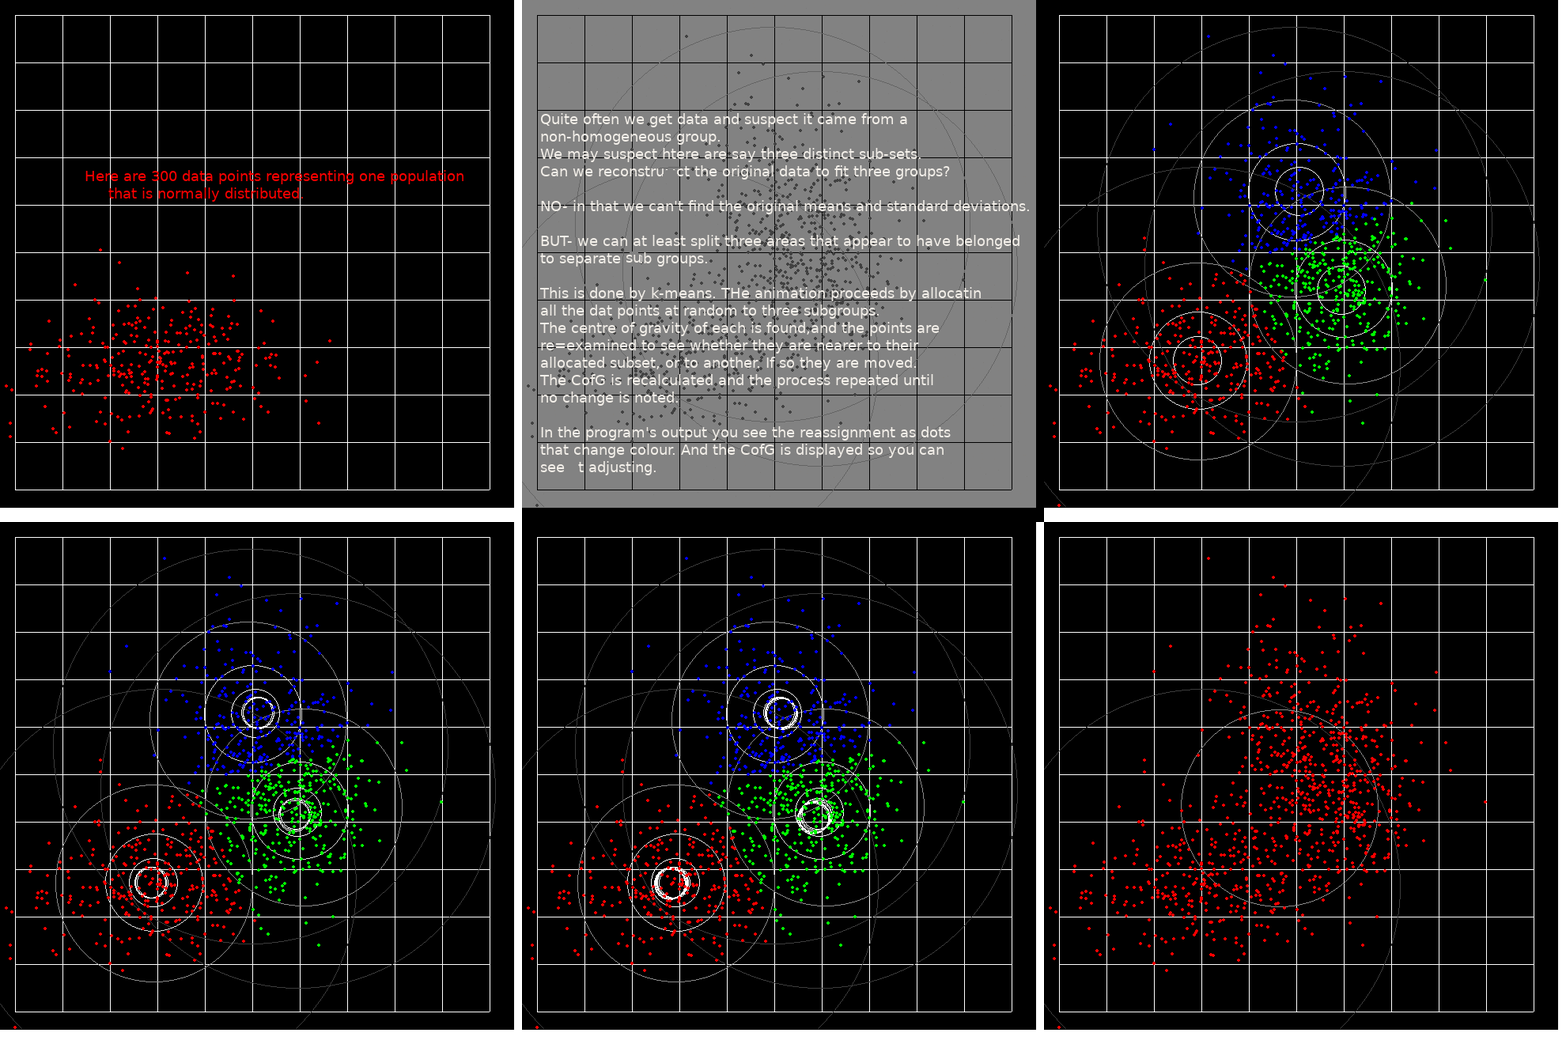
And now the same, but 900 data points allocated to three ( colour) groups. Since the initial data was in three overlapping normal scatters, some points end 'changing colour', ie being assigned to the wrong colour.
