Epidemic growth and limit.


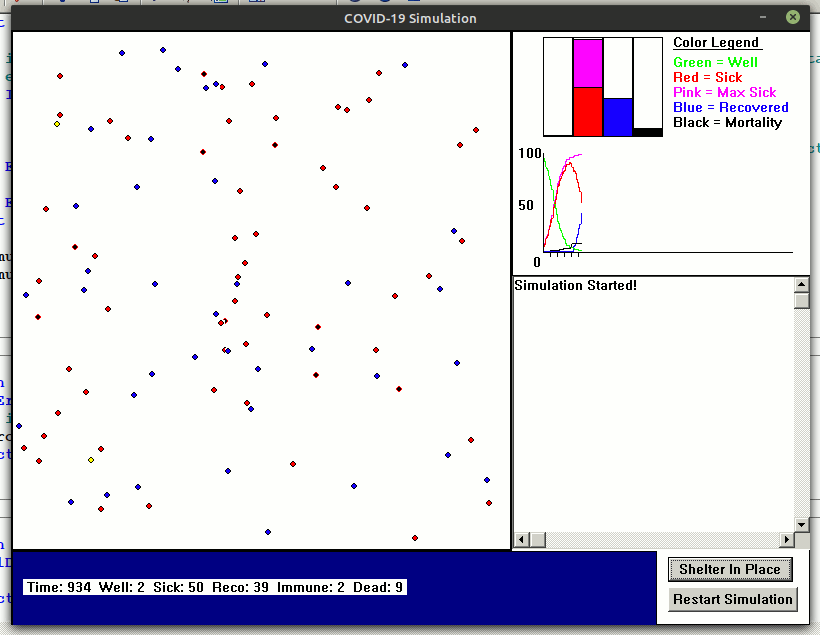
It ties in with the various 'epidemic' simulations we played with on this Forum. See Pandemic simulator which displays as an animation people moving around and infecting each other when close. Some recover, some die.... in a classic Monte Carlo simulation.

The least-squares method in statistics is used to fit data to the best of a family of similar curves by finding the parameters for a curve which minimizes the total of the distances from each data point to the curve.
Often, the curve used is a straight line, in which case the method is also called linear regression. If a curve which uses logarithmic growth is fitted, the method can be called logistic regression.
A commonly used family of functions used in statistical studies of populations, including the growth of epidemics, are curves akin to the logistic curve:
f(t) = N0 *exp( r *t) / ( ( 1 +N0 *( exp( r *t) -1) /K)
Though predictions based on fitting to such curves may error, especially if used to extrapolate from incomplete data, curves similar to the logistic curve have had good fits in population studies, including modeling the growth of past epidemics. Initially growth is exponential, but as the available uninfected population becomes smaller it tails off until all the population has had the disease, and either recovered or died.
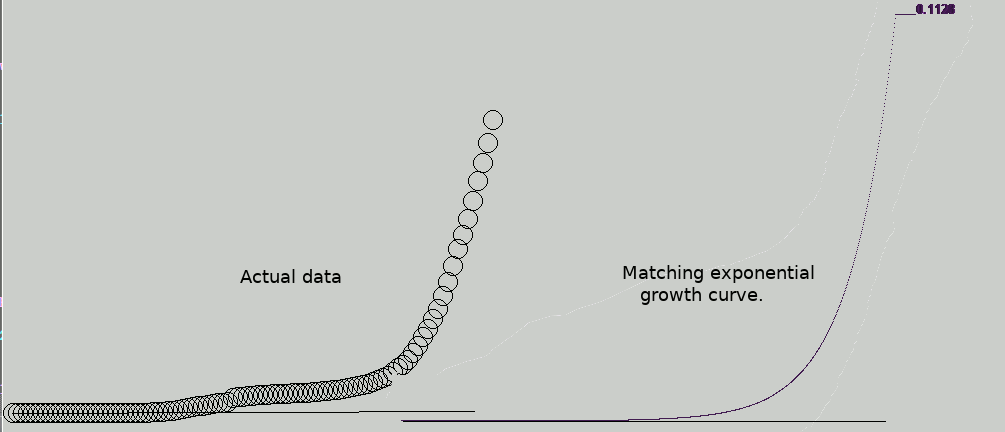
Rosetta gives as data the daily world totals through the first 80 days after December 31, 2019 for persons who have become infected with Covid-19: this looks like this graph-

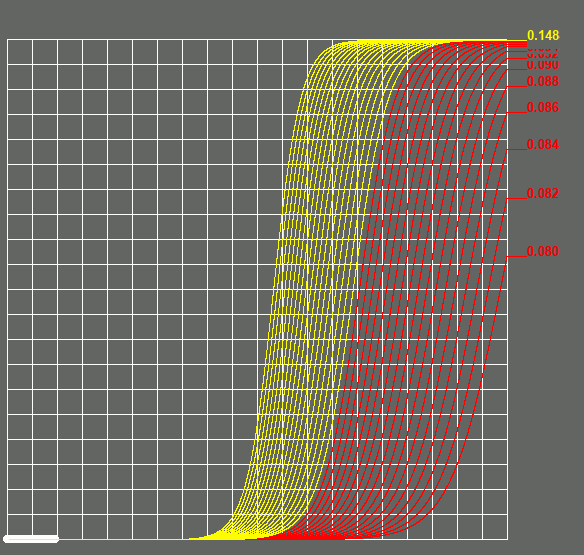
Carrying forward to stages where a substantial proportion of the population has been infected, we see the curve limit towards the total population.

These data show it was not a purely exponential rise- which may be real or an artefact of how it was being detected and recorded. Certainly, to fit a logistic curve towards fully infecting the whole World population is pretty 'hopeful'!
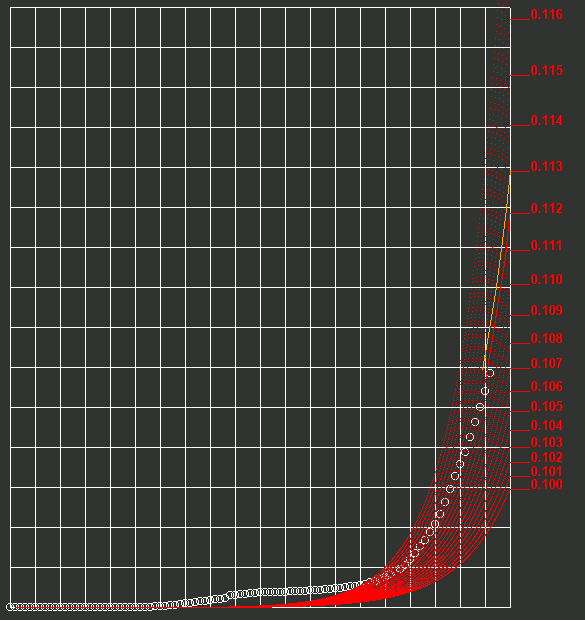
I simply played with showing the initial real data against the logistic curve, with 'r' in the area of the value found by the suggested analysis. It would be comparatively trivial to calculate 'r' by bracketing in with successive 'guesses'.
Example code is in epidemic.zip