Can you guess what this dataset represents? Not without help.. but by all means download it and try your own 'visualisations'.
A typical 2D dataset might represent vegetation type; soil conductivity; magnetic field intensity; ground-penetrating radar signal return; and even ( occasionally!) elevation above a datum like sea-level. It may represent isolated and unconnected values ( a sparse set)- say 'a church is here'- or regularly spaced samples of a continuous distribution. Closely related to things like lidar.
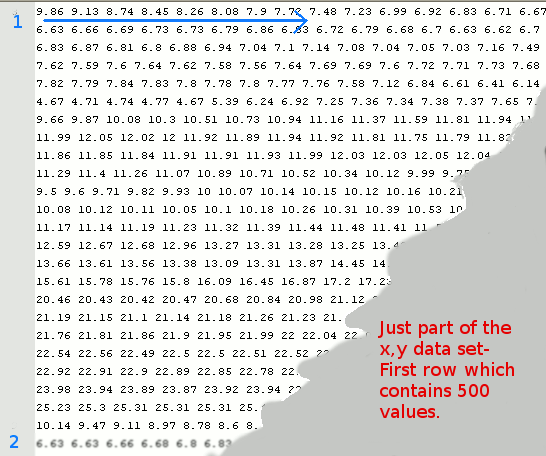
The data shown here is 250,000 values, measured on a 500x500 x/y grid. Just looking at the numbers you have NO IDEA what they might represent. Scanning by eye you can see neighbours have similar values, and get a rough idea of max & min. Little else.
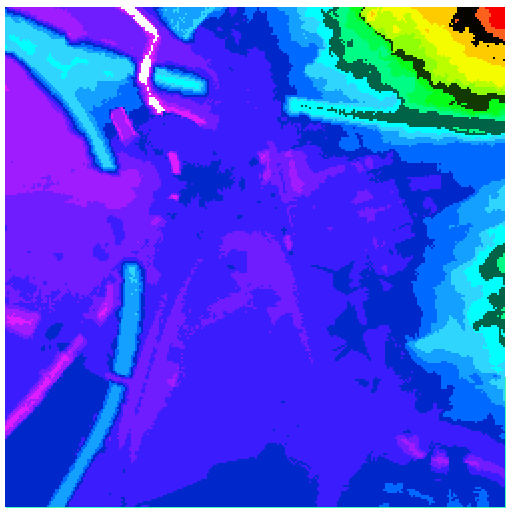
However there are ways to make it easier on the eye. One is to colour-code the values. Here I've alrready 'cheated' since I had some idea of max & min, and could therefore better use the colour range.


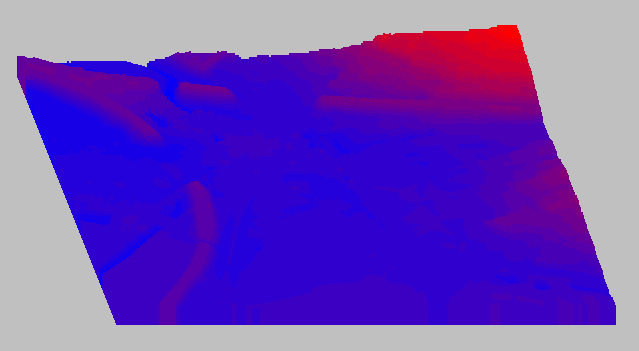

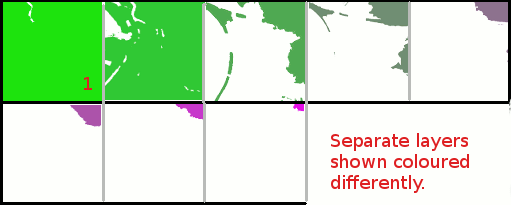
Another way of helping humans attempting to analse this same data is to allow cross-sections to be examined at will, as done for the following software version- or examine the layers side by side.
 -
- 

I haven't yet tried writing a version to show an x/y 'net'. To be useful with such big datasets you'd need to either scroll across a VEY large image, or perhaps do in vector format like svg. Both do-able in LB.
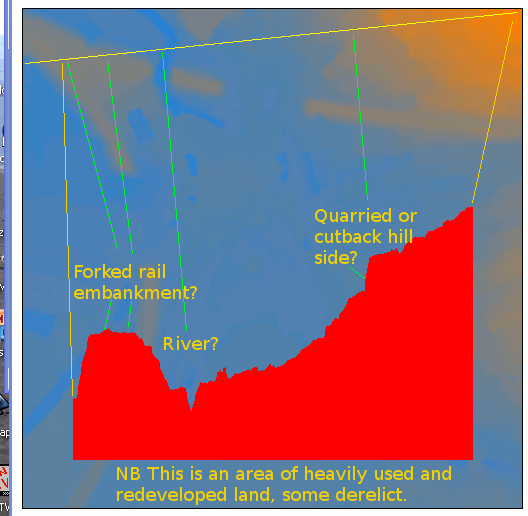
By now we've a better idea of what is going on. I'll still not tell you what the data represents- it could be ground elevation, but could also be height of tree canopy top, or soil moisture or .....
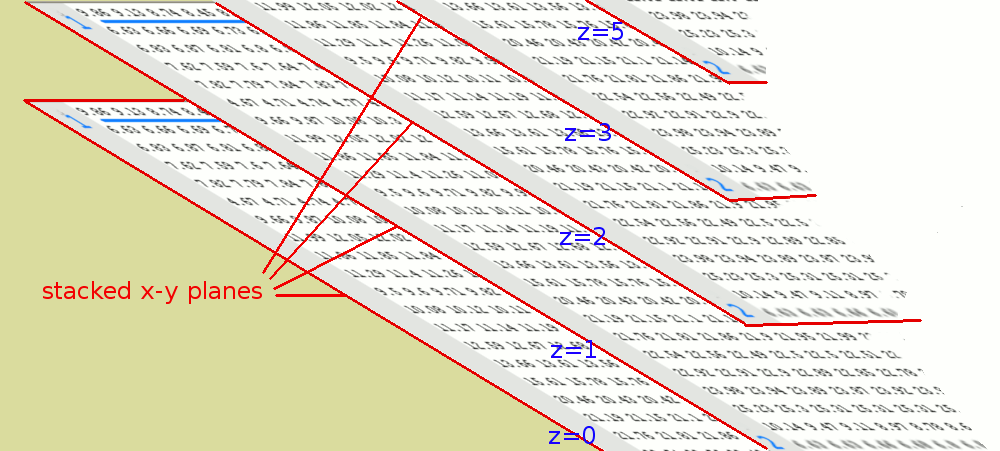
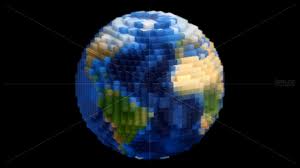
Now we have a dataset that associates a value with every location in 3D space- sometimes called a voxel. The simplest case is for the data again to be scalar.
 -
-
 -
-

 -
-
ImageMagick can be run from within LB or from the command line- 'convert -resize 200x200 -delay 200 *.bmp anim3D5.gif'.
PS Are you any clearer on what the 2D dataset represented? Look at http://www.bluesky-world.com/downloads/#
You may want to visit my other pages at Diga Me!