'Showing' details of constellations.
This activity was prompted by blind LB user Ray MacAllister, who was wondering if LB could help him get an image of the traditional constellations of stars that seeing people refer to. His interest is in using star coordinates as seeds for generating Newtonian fractals. It has led me to some fun areas.
I supplied seven coordinates scaled to fit a LB graphics screen.
106 303
189 254
246 262
326 267
362 316
465 276
455 201
Here's what Ray made with them!
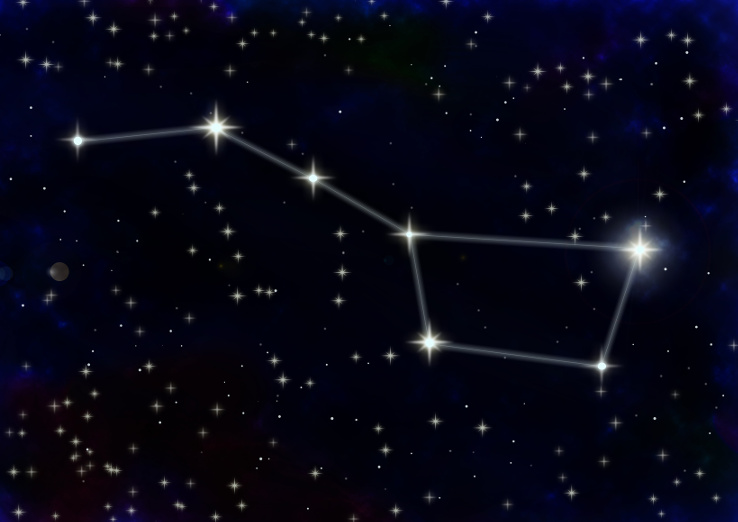
An astro-photograph of The Plough ('Big Dipper', 'Ursa Major' or 'saucepan'.
It is a fudge- the photo is doctored and lines are superposed; the important stars are made larger and brighter; and as the Earth revolves it is seen at different angles and positions in the sky anyway.
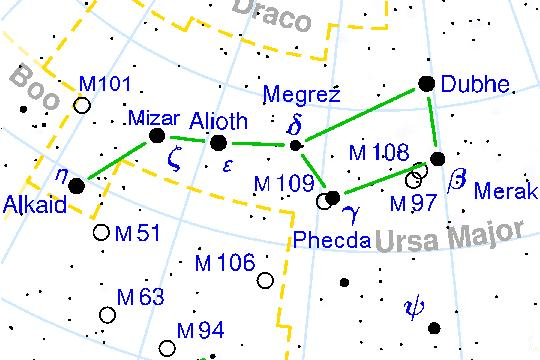
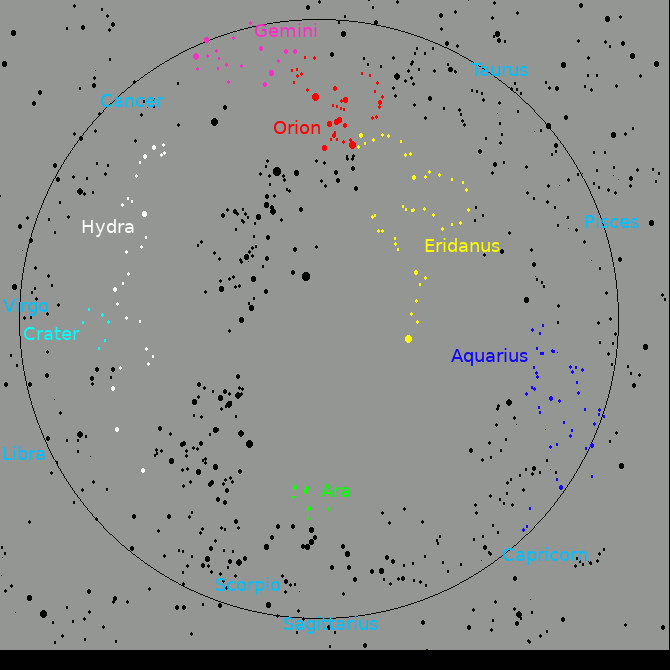
This diagrammatic picture is little better- the stars are named, but it is cluttered and needs time to work out what it is showing.
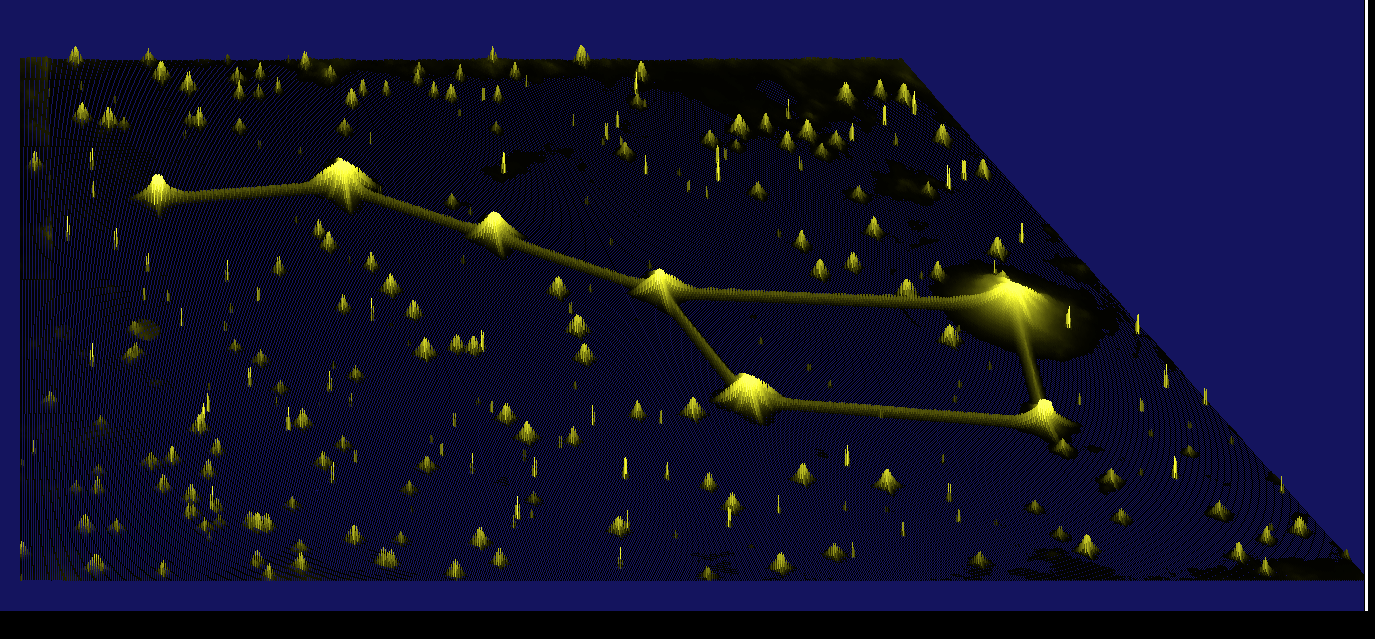
You can easily process images in LB.The following image is a pseudo-perspective image of the above astro-photo with brightness coded as vertical displacement.
How could a blind person be helped to get to grips with such images?
Ray can code very well and understands cartesian x-y coordinates and relevant maths very well, but star atlases give locations in spherical coordinates, azimuth and altitude. I wrote code that took constellation images found on the 'net' which I scaled to a suitable size bmp for LB to show. I then coded so my mouse clicks would display the x-y coordinates, which I could have got directly in Gimp/Photoshop. My thoughts were to use a touch screen and detect when a touch was made on a star. It could then use eSpeak to announce its name and role in the image- eg 'start of handle of the plough' and its name and special features.
This all works quite well but I find eSpeak words hard to understand. I could of course save a wav file for each hot-spot and play that. I can also get the computer to say 'your nearest star is in direction so-and-so about n-pixels away.'. Effectively I am using LB like a web image-map but one which recognises distances rather than treating a whole area equally.
Other thoughts
I talked to a friend who marks maths exam scripts sometimes of blind pupils, and she said that sometimes they would be given diagrams embossed on a surface. I'd already thought of this- if I had access to a laser cutter or router I could make a finger-readable panel.
I looked up the price of Braille embossers- they are outrageously expensive for an individual. I wonder if any amateurs have made anything- effectively a dot-matrix punch with a new coder and drive software?
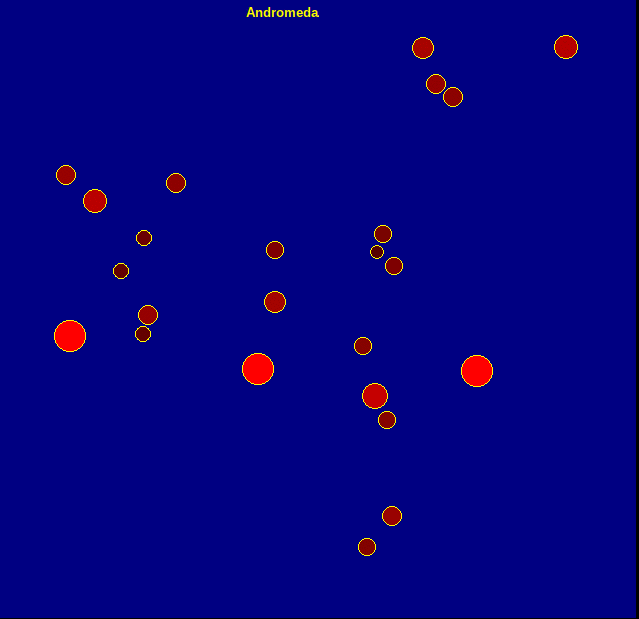
An animated set of constellations.
The data set was run to draw the main stars of each constellation, always scaled to a full graphic screen. I've coded brighter stars as larger and brighter coloured- of course all stars look like points, and their colour depends on temperature and type.
I'll probably redo the animation, following each constellation with the traditional connecting lines, and possible either astro-photo or old-fashioned imagined figures!
Hand annotated output
< ">
">
Code and data file at my Constellations
I'm still playing, and would be interested in other people's ideas... see the forum for the espeak version. Will add code here too.